Here is a collection of free value investing Excel spreadsheets and checklists. These tools can help you get a more long-term perspective and become a more disciplined, rational and patient investor. Remember that the intrinsic value calculators are just an estimation of the value of the stock. Do your own research and don’t rely solely on the intrinsic calcultors.
Most of the Excel valuation spreadsheets on this page is included in The Warren Buffett Spreadsheet which is an automatic spreadsheet that will give you the intrinsic value calculation in a few seconds for each stock instead of having to manually plug in alot of data into the spreadsheet. Saves you a lot of time in your stock analysis.
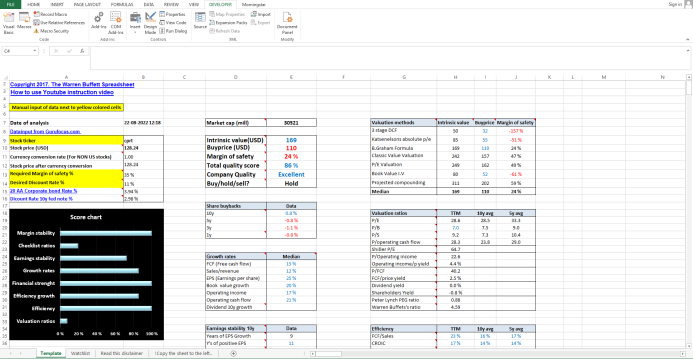
The compounding annual growth calculator:
Einstein said: “Compound interest is the eight wonder of the world” This tool let you see the magic of compounding and how important it is to start to save and invest early and how small differences in annual returns can have a huge influence of the total amount of money after a long time period. Wonder how much 1.000$ invested with an annual return of 8% is 50 years in the future? The answer is 43.427$. If you instead can get a return of 10% the amount increase to 106.719$
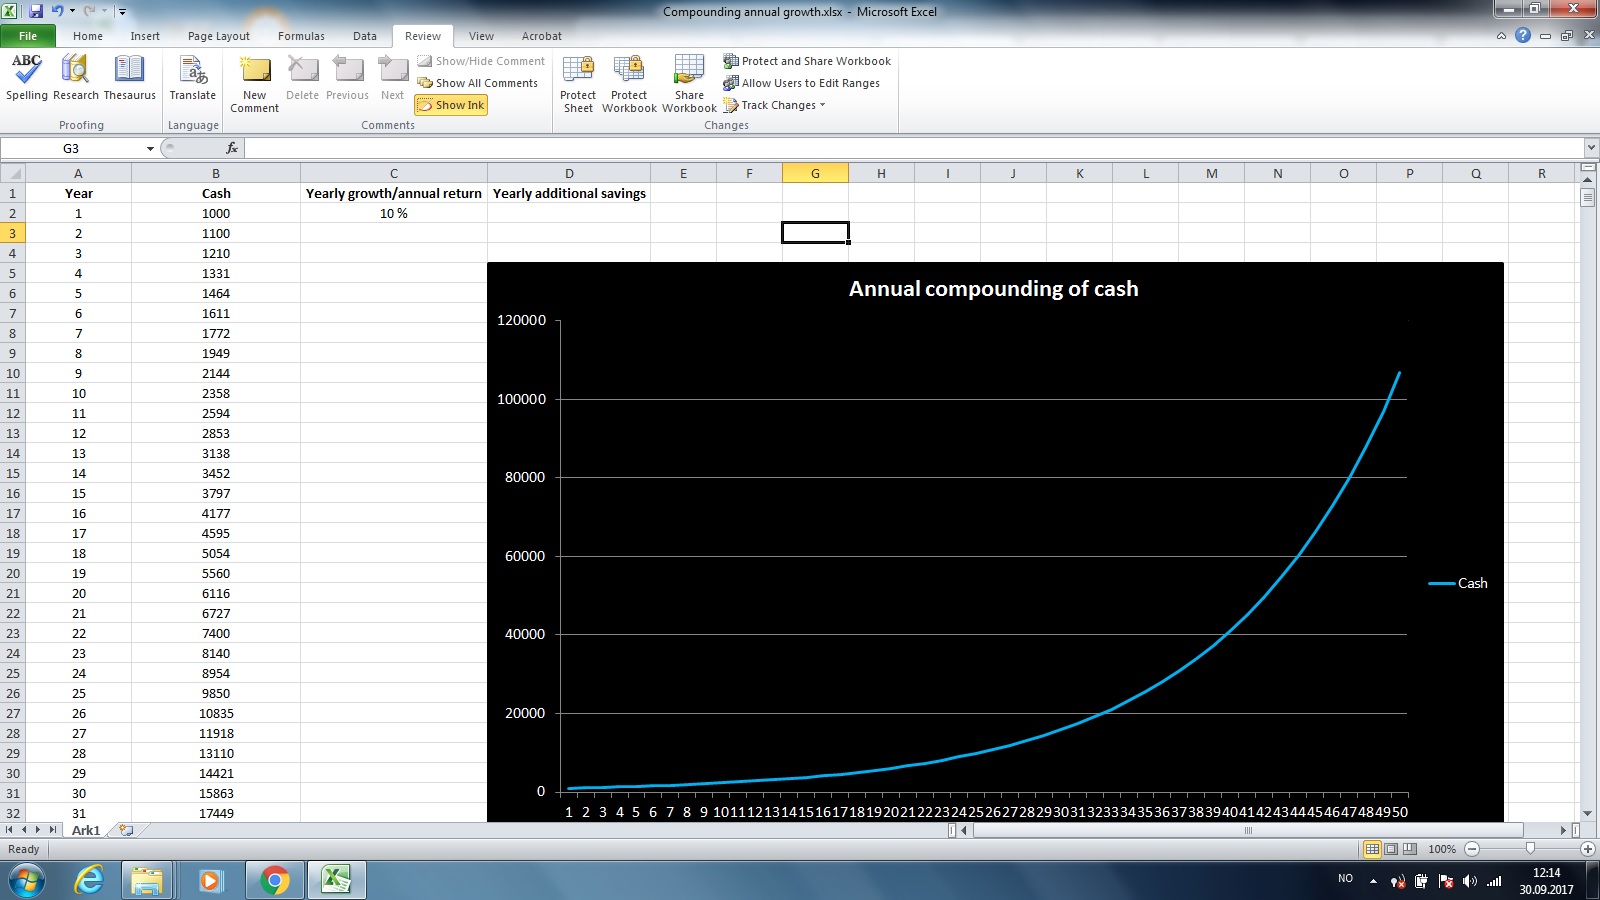
The total portfolio value spreadsheet:
This spreadsheet lets you register your total portfolio value over time. There are benefits of doing this instead of focusing on individual stocks return. The benefits are mostly behavioral. It means that as long as the total portfolio value is increasing over time you are doing things right. We often can get too obsessed about each stocks returns in the portfolio, and trade too much because of this. This tool keeps your perspective in order with your long-term goals and its also good way to actually see for yourself that over longer periods of time there is usually a steady increase in the total value, even it sometimes don’t feel like it if we check our portfolio too often. I suggest you at maximum record the value of your portfolio once per month. Anything more is just noise for the long term investor.
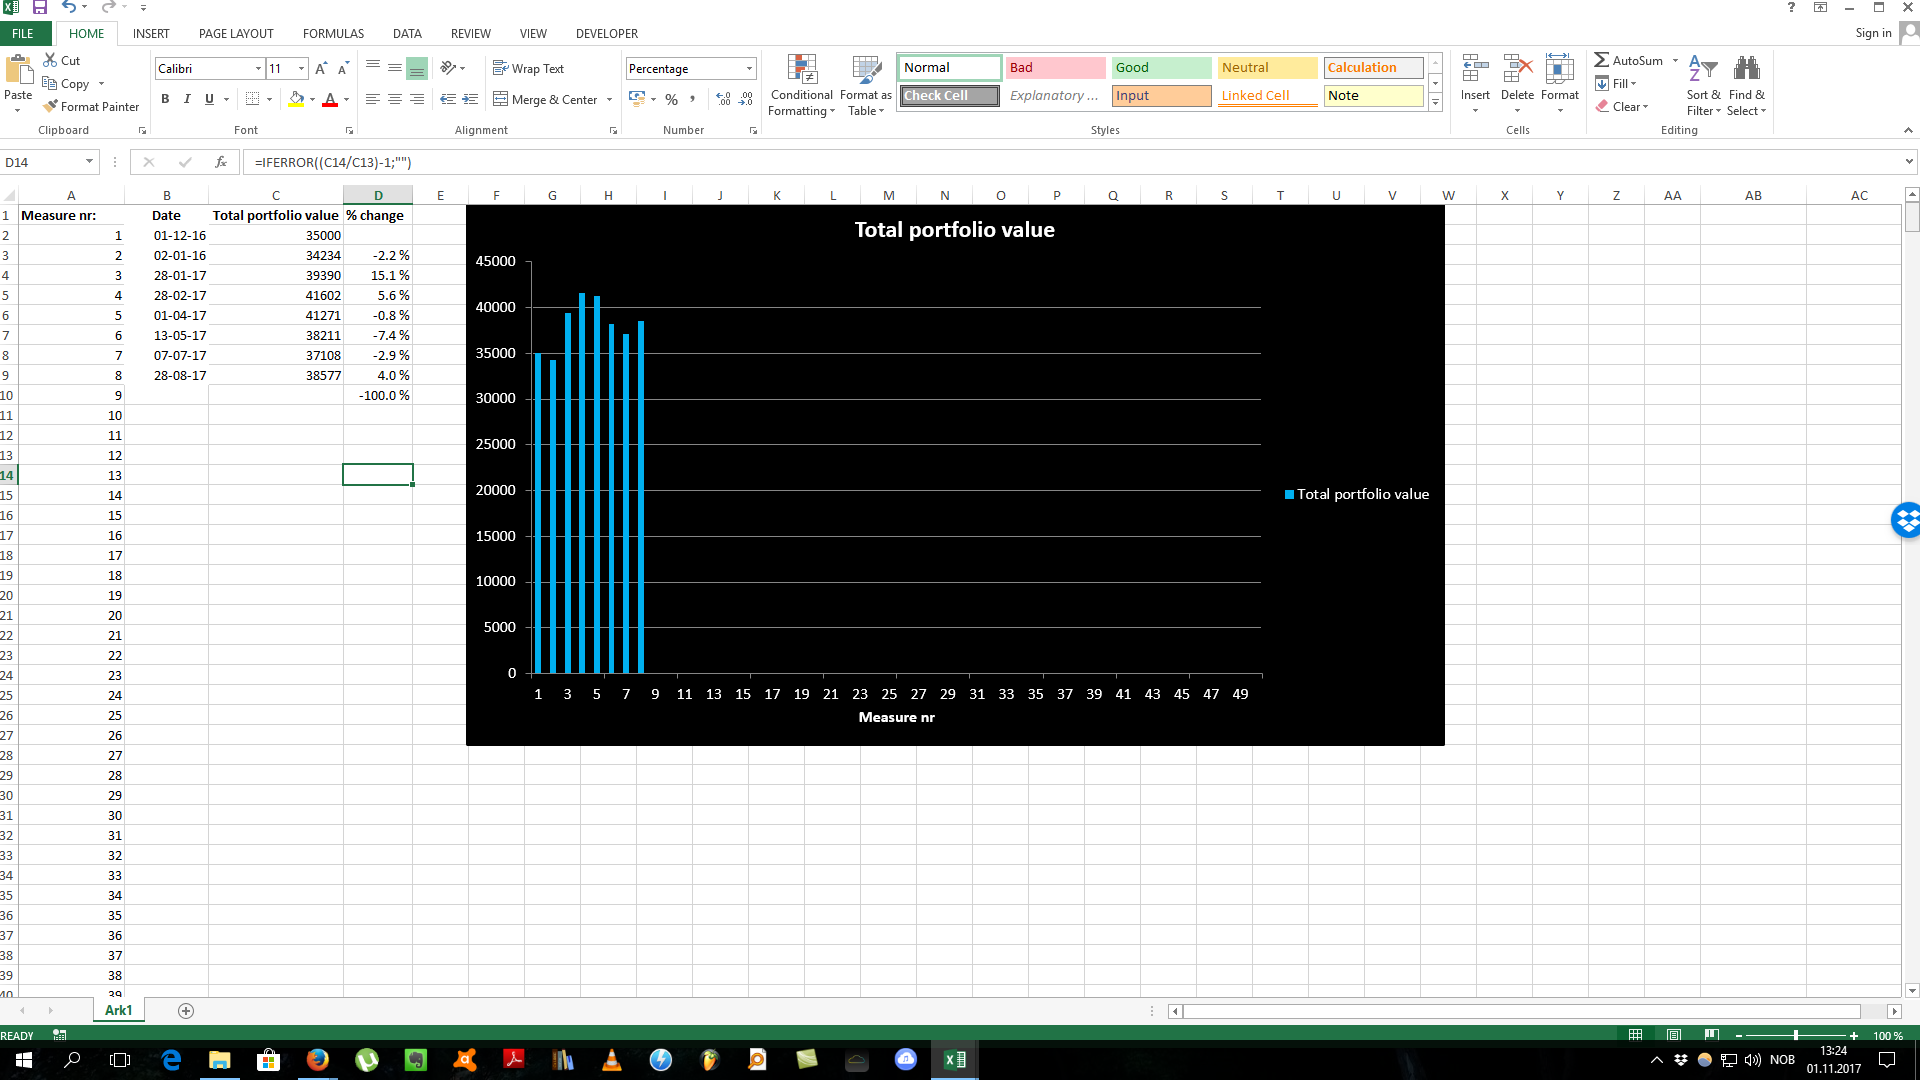
Stock portfolio tracker
This is a simple tool to keep track of your total returns on your investments. Works only for US-listed stocks and its excluding any dividends that you might receive. However the tool give a good way to keep track of your returns and with good visual presentations. ![]()
*Remember to make a copy to your own drive first. Click: “File” – “Make a copy” in Google sheet before you can begin to edit and use the spreadsheet.
Click here to get access to the Stock Portfolio Tracker
The free stock watch list:
I have developed a stock watch list that can be used to save interesting stock that you have analyzed. You can also compare today’s price with the estimated intrinsic value and see your margin of safety. The data is provided from Google Finance and its updated automatically as soon as you type in a stock ticker
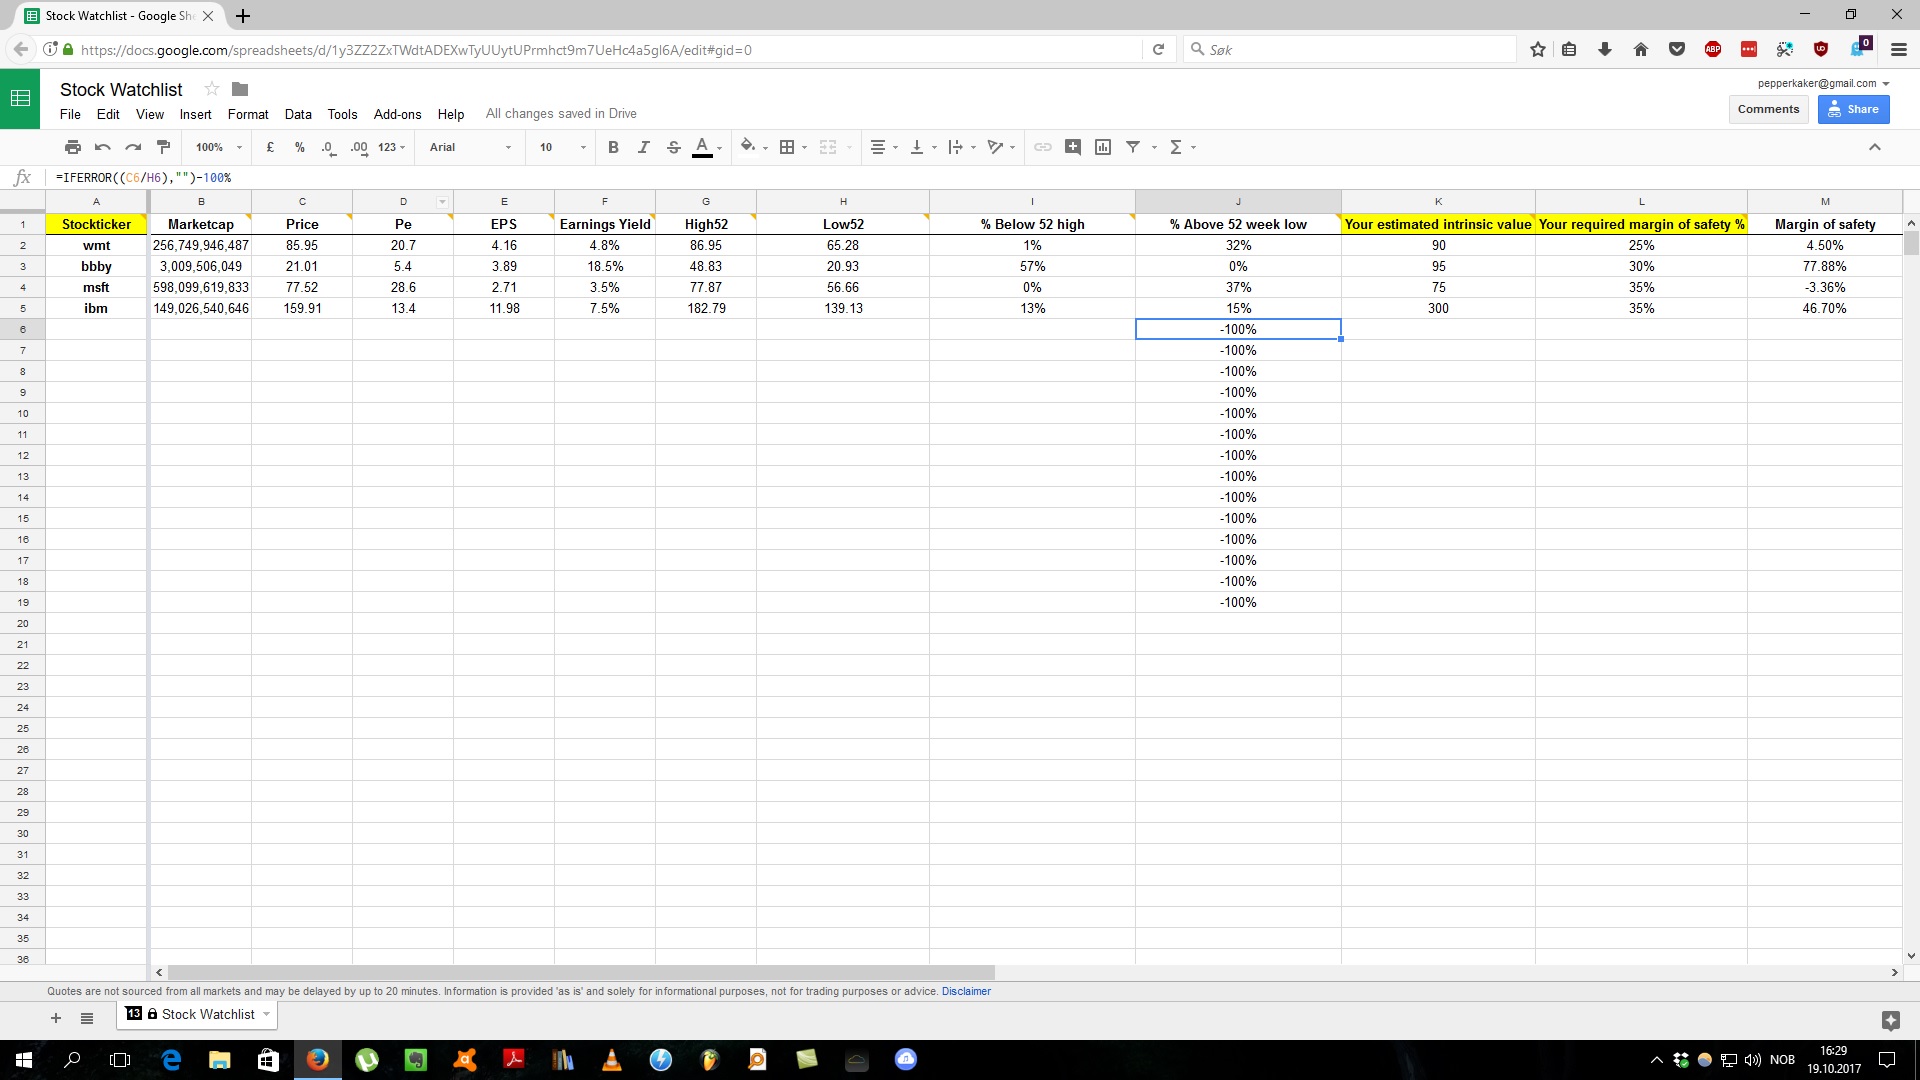
Click here to get access to the free stock watch list
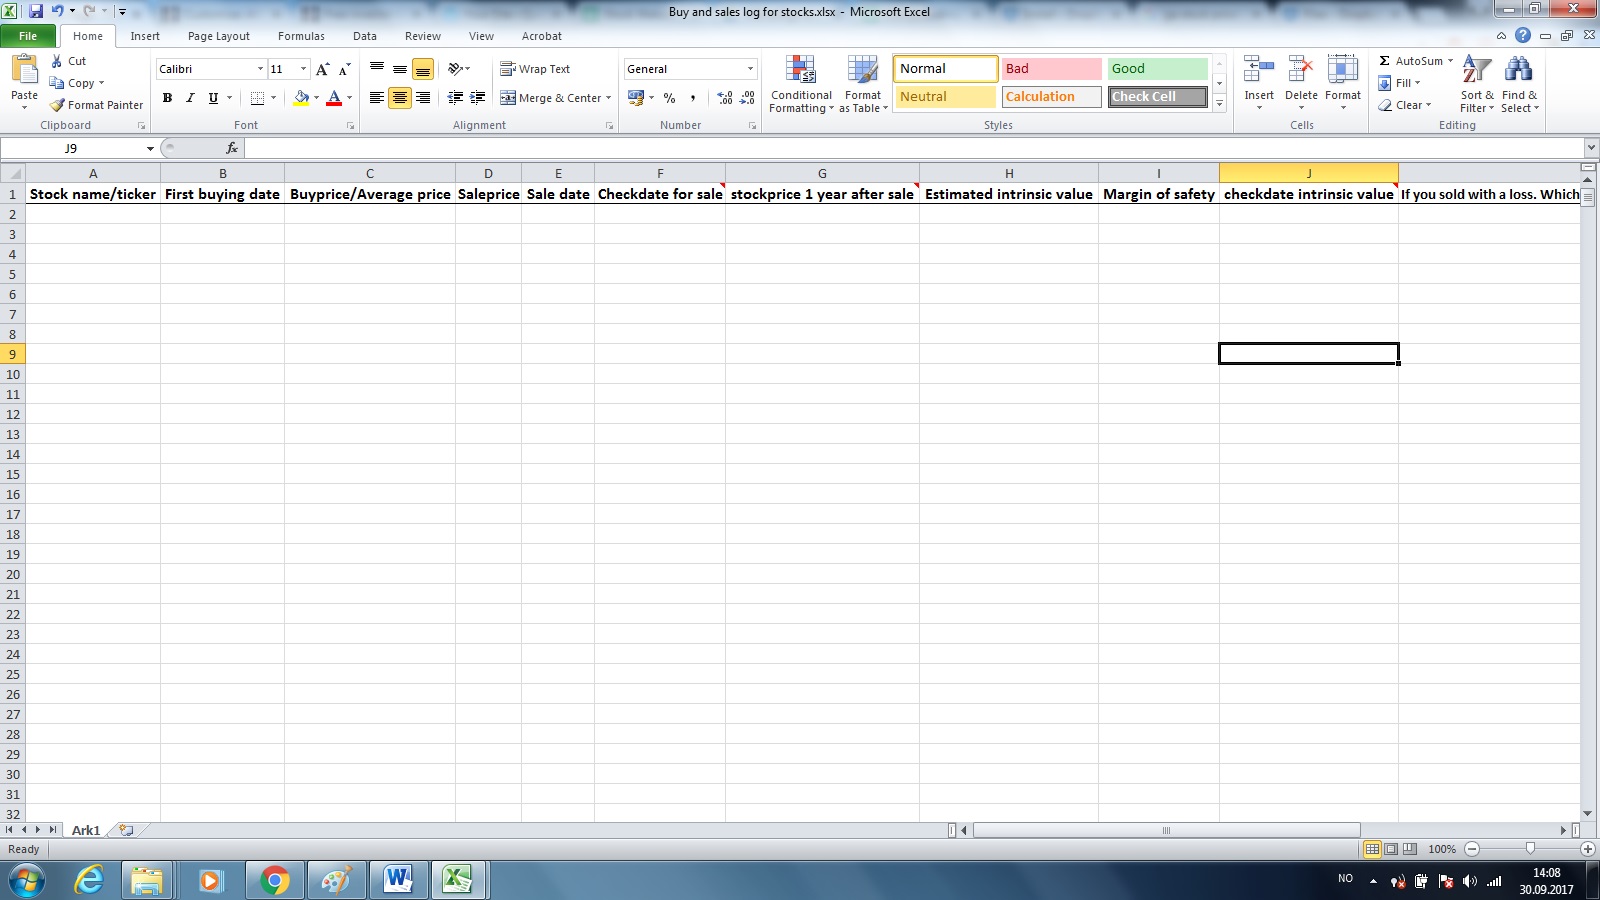
The buy and sale log for your stocks
This excel sheet lets you keep track of all your buys and sales of your stocks. You can also register important dates for reviewing you stocks and noting down the intrinsic value
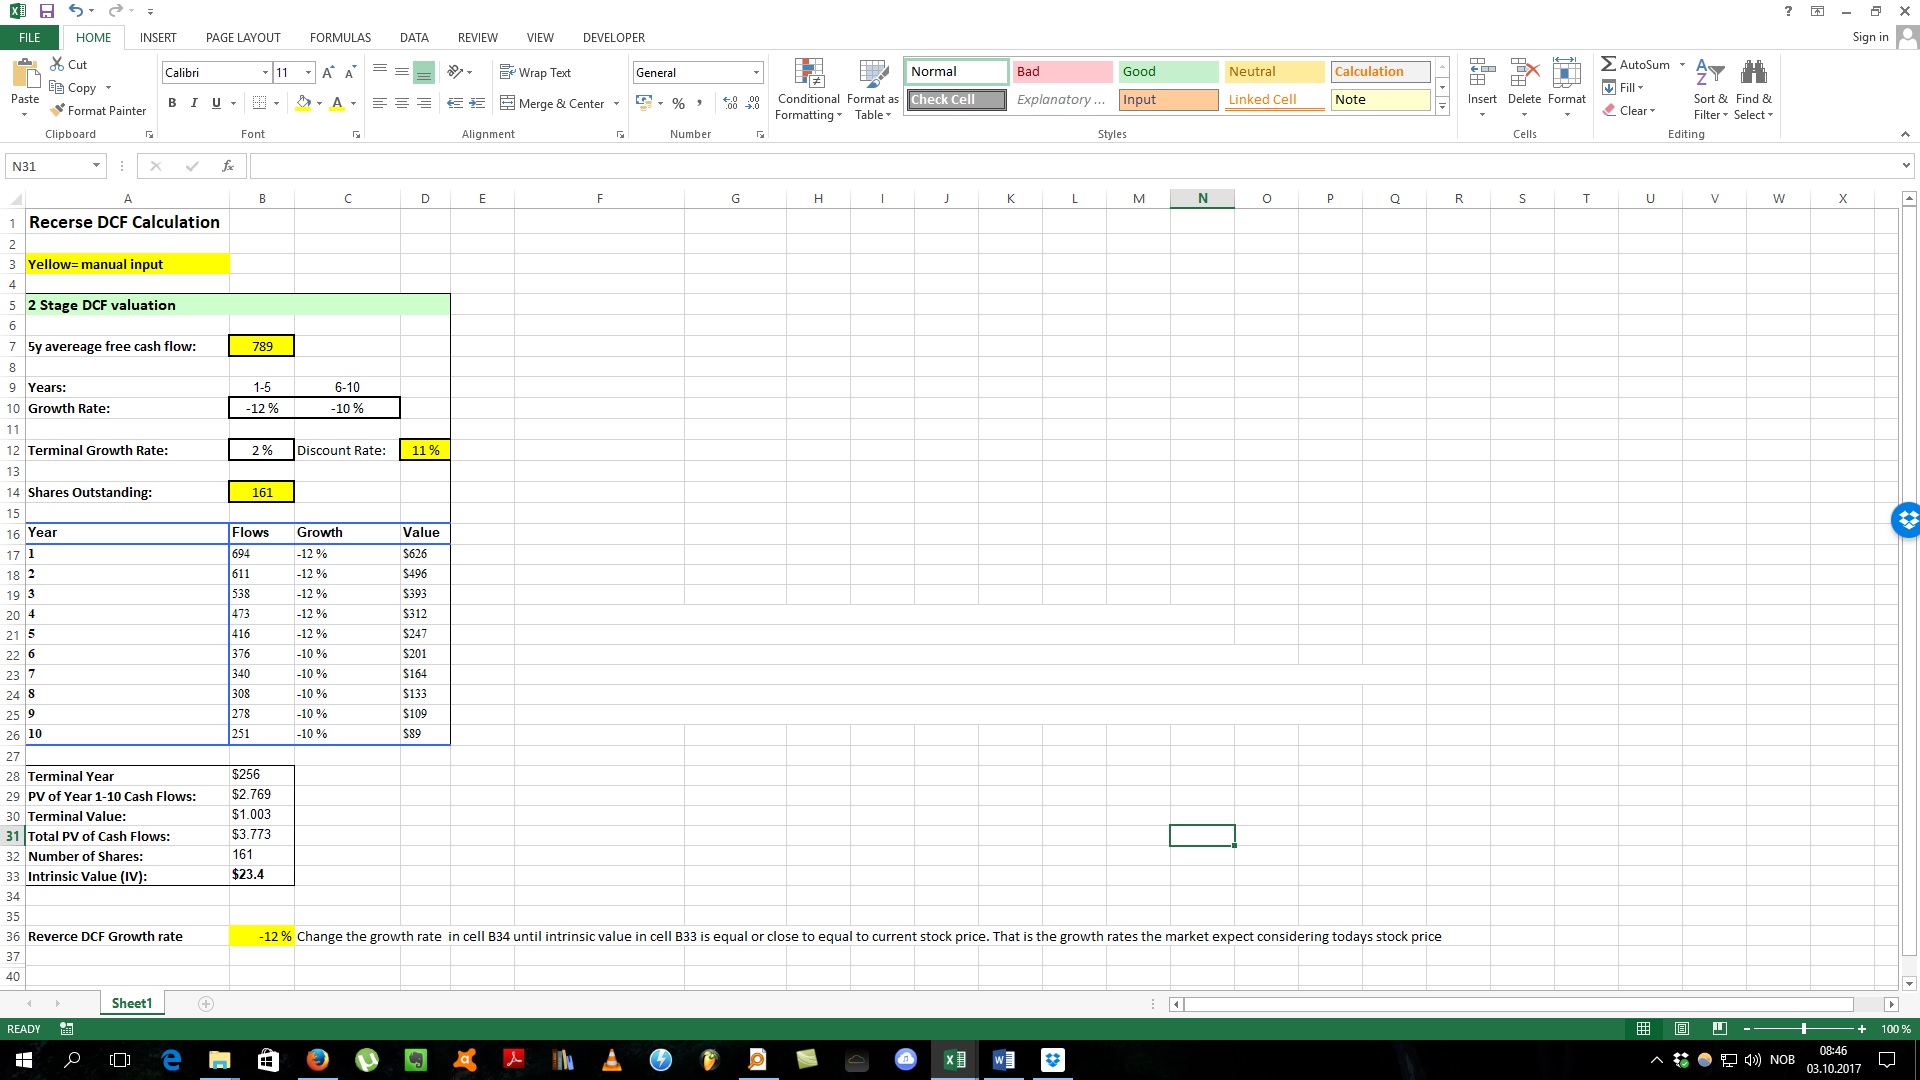
The Reverse DCF Calculator
This calculator is useful, because unlike the normal DCF analysis that only estimates the intrinsic value based on future cash flow, this one let you see the growth rate that is expected by the stock market at the stocks current price. You can then based on the expected growth rate make a judgement if you agree or disagree with the markets prediction. This can be easier than to judge whether the intrinsic value is really higher than the current stock price. It’s easier to judge whether the expected growth rate is fair considering the stocks historical growth rates.
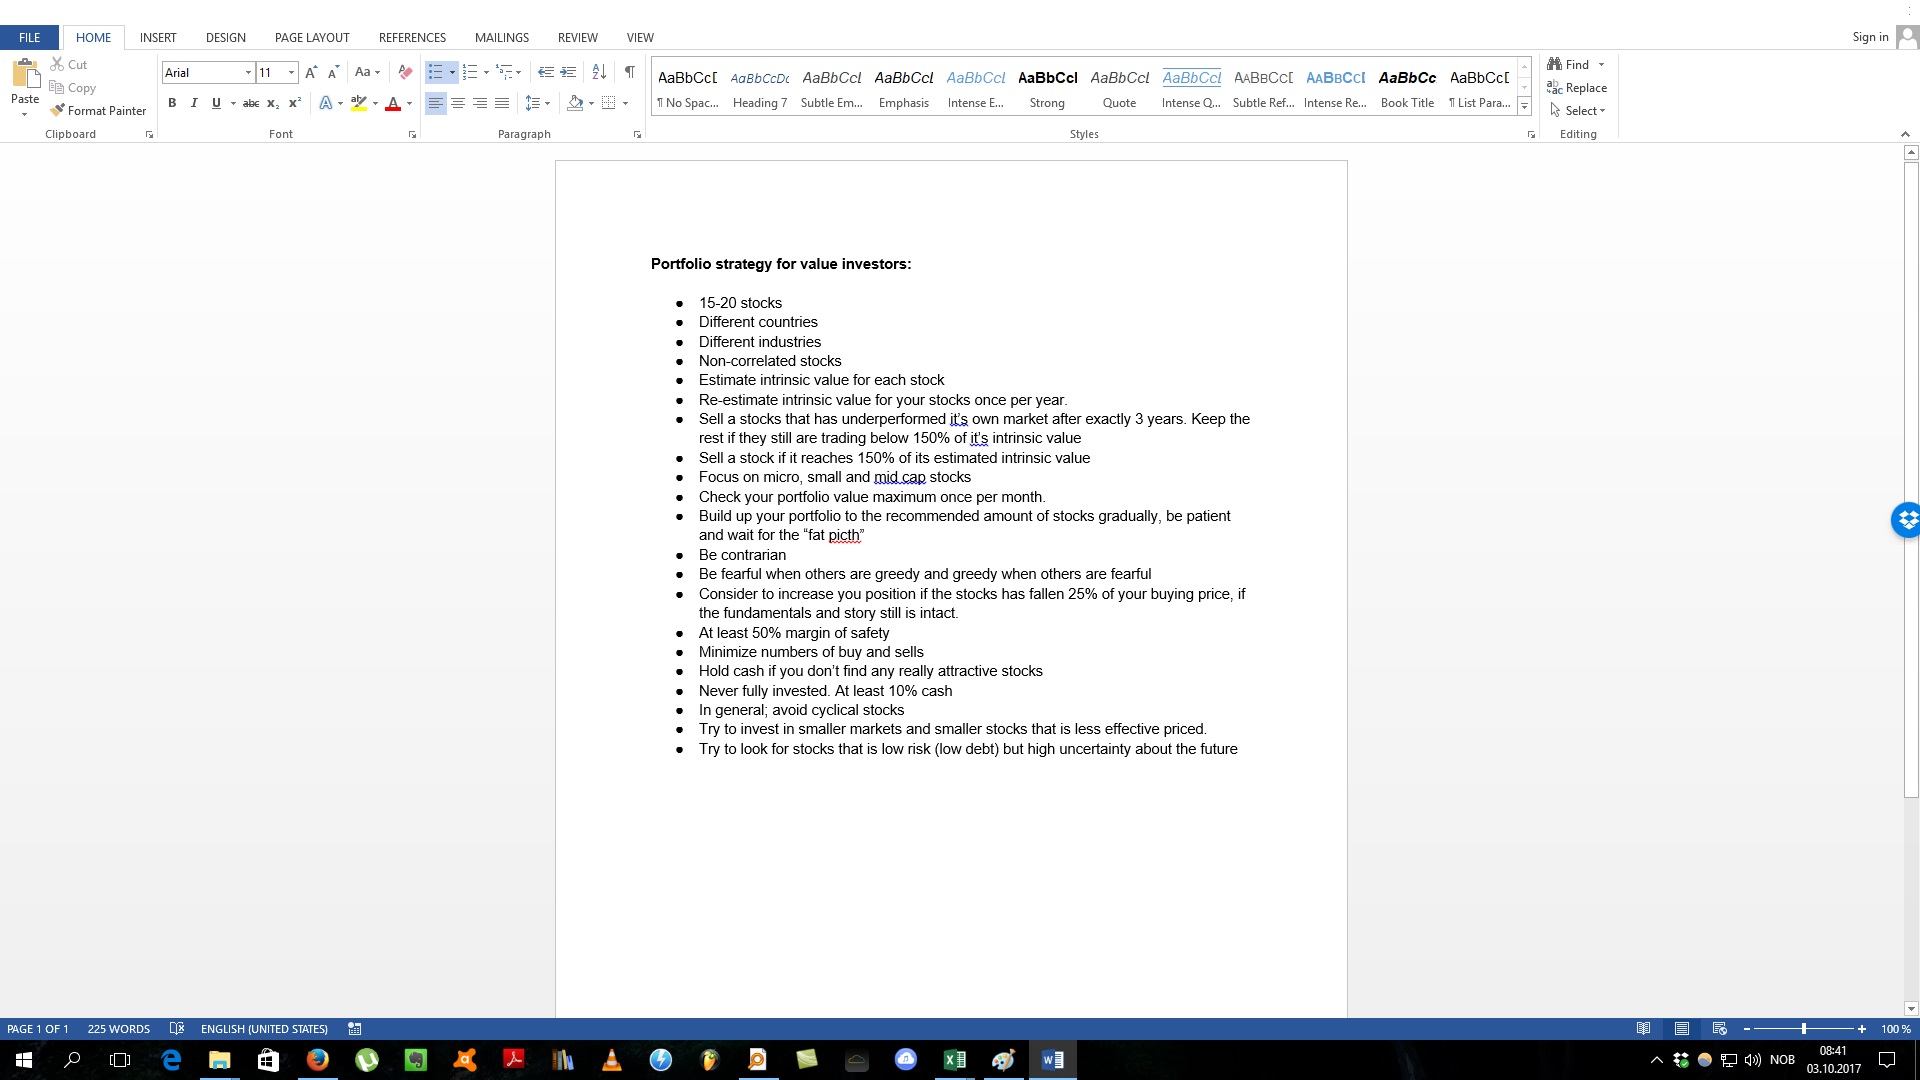
Portfolio strategy for value investors
This word file contains around 20 recommendations for portfolio construction and strategy. It is a synthesis of advice from the best long-term value investors coming from sources like books and interviews. Gives you a good framework for how you should be a good investor.
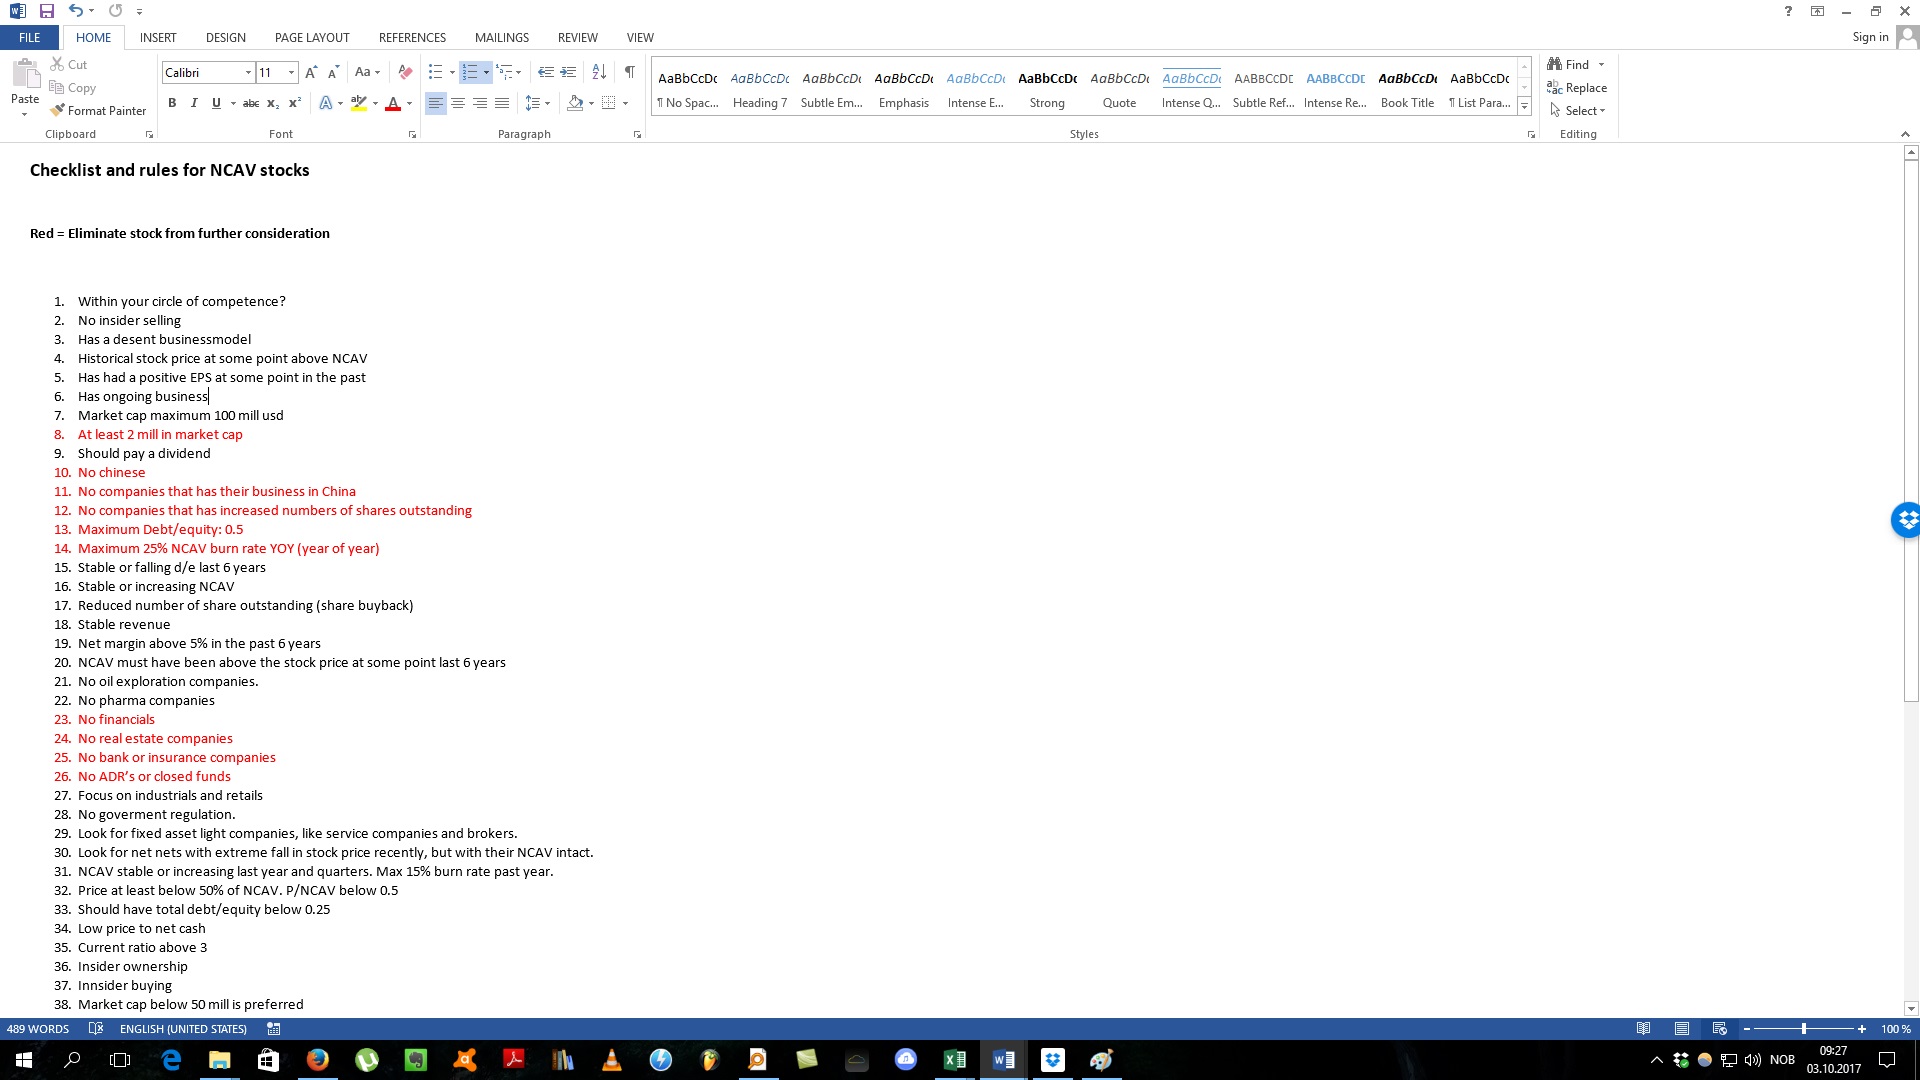
The Net Net stock checklist
This is probably the most comprehensive Net Net checklist that you will find online. It’s checklist points is gathered from books, online articles, and interviews. Especially from books and interviews of Jeroen Bos. The author of the book Deep Value Investing
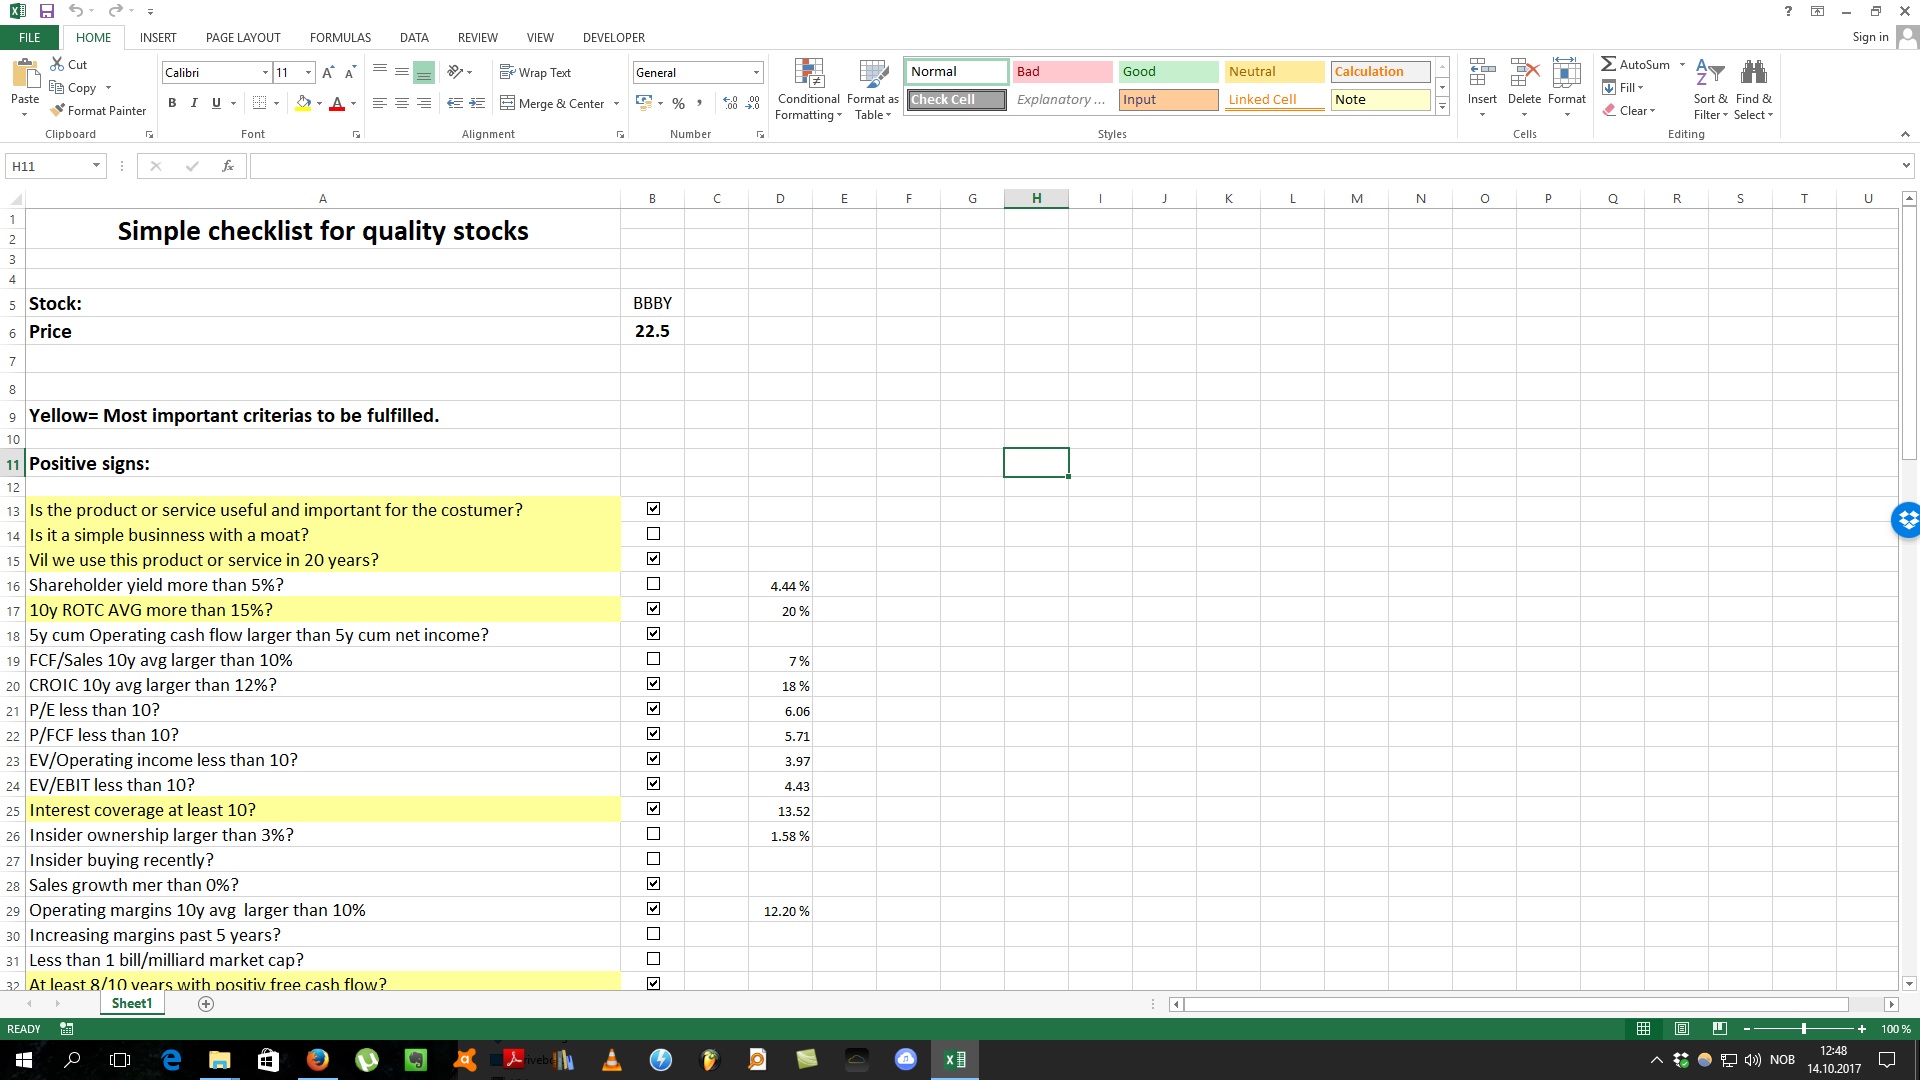
Simple checklist for high quality stocks
This is a simple checklist for quality stocks that covers the most important checklist items that you should be aware of before buying a stocks. It covers checklist items that give you information about the moat, management, profitability, financial strength, valuation and sentiment of the company.
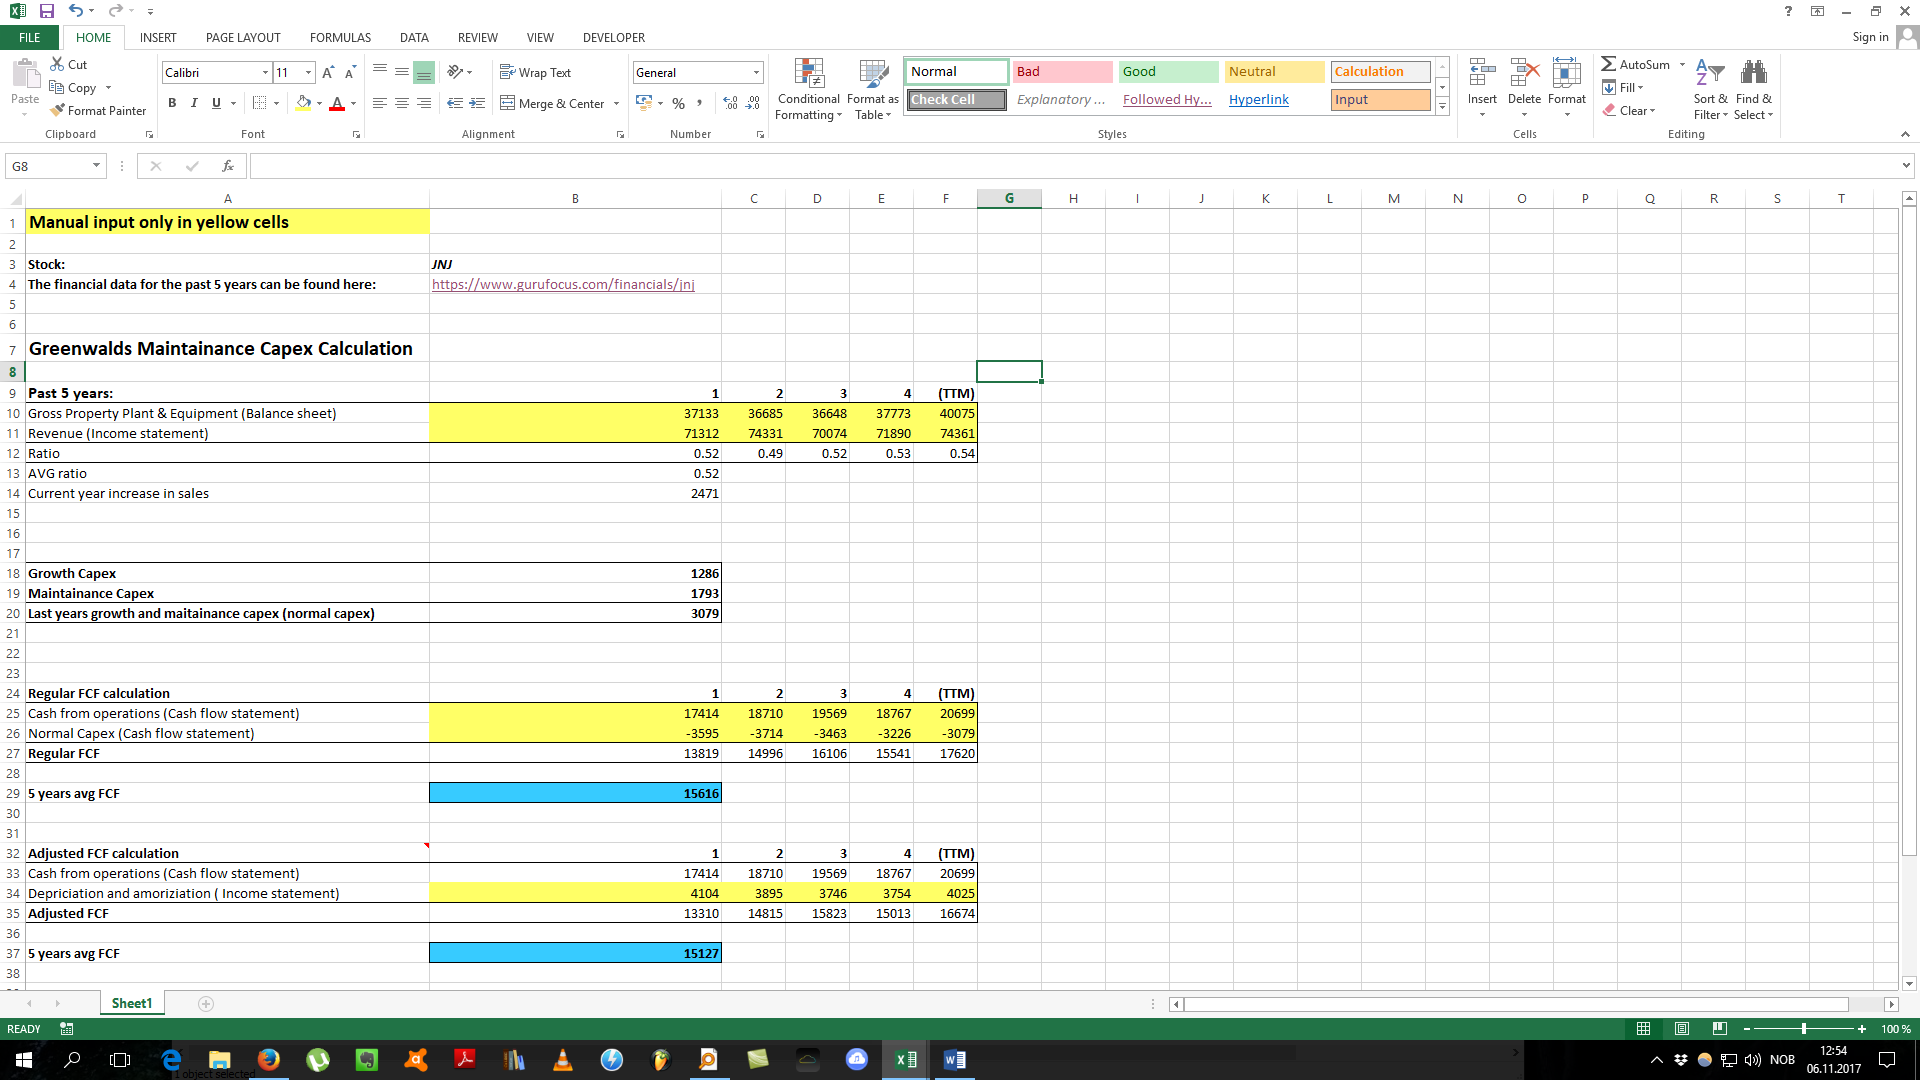
Bruce Greenwalds maintainance capex calculation spreadsheet
This is a spreadsheet that uses a simple formula to separate a companies capex (capital expensitures) into maintainance capex and growth capex. We like to separate these so that we can see what it cost just to keep the business going (maintainance) and how much is used for growth, that can produce additional income for the company in the future. This spreadsheet can be used on stable and mature companies that does not have too high capex requirements.
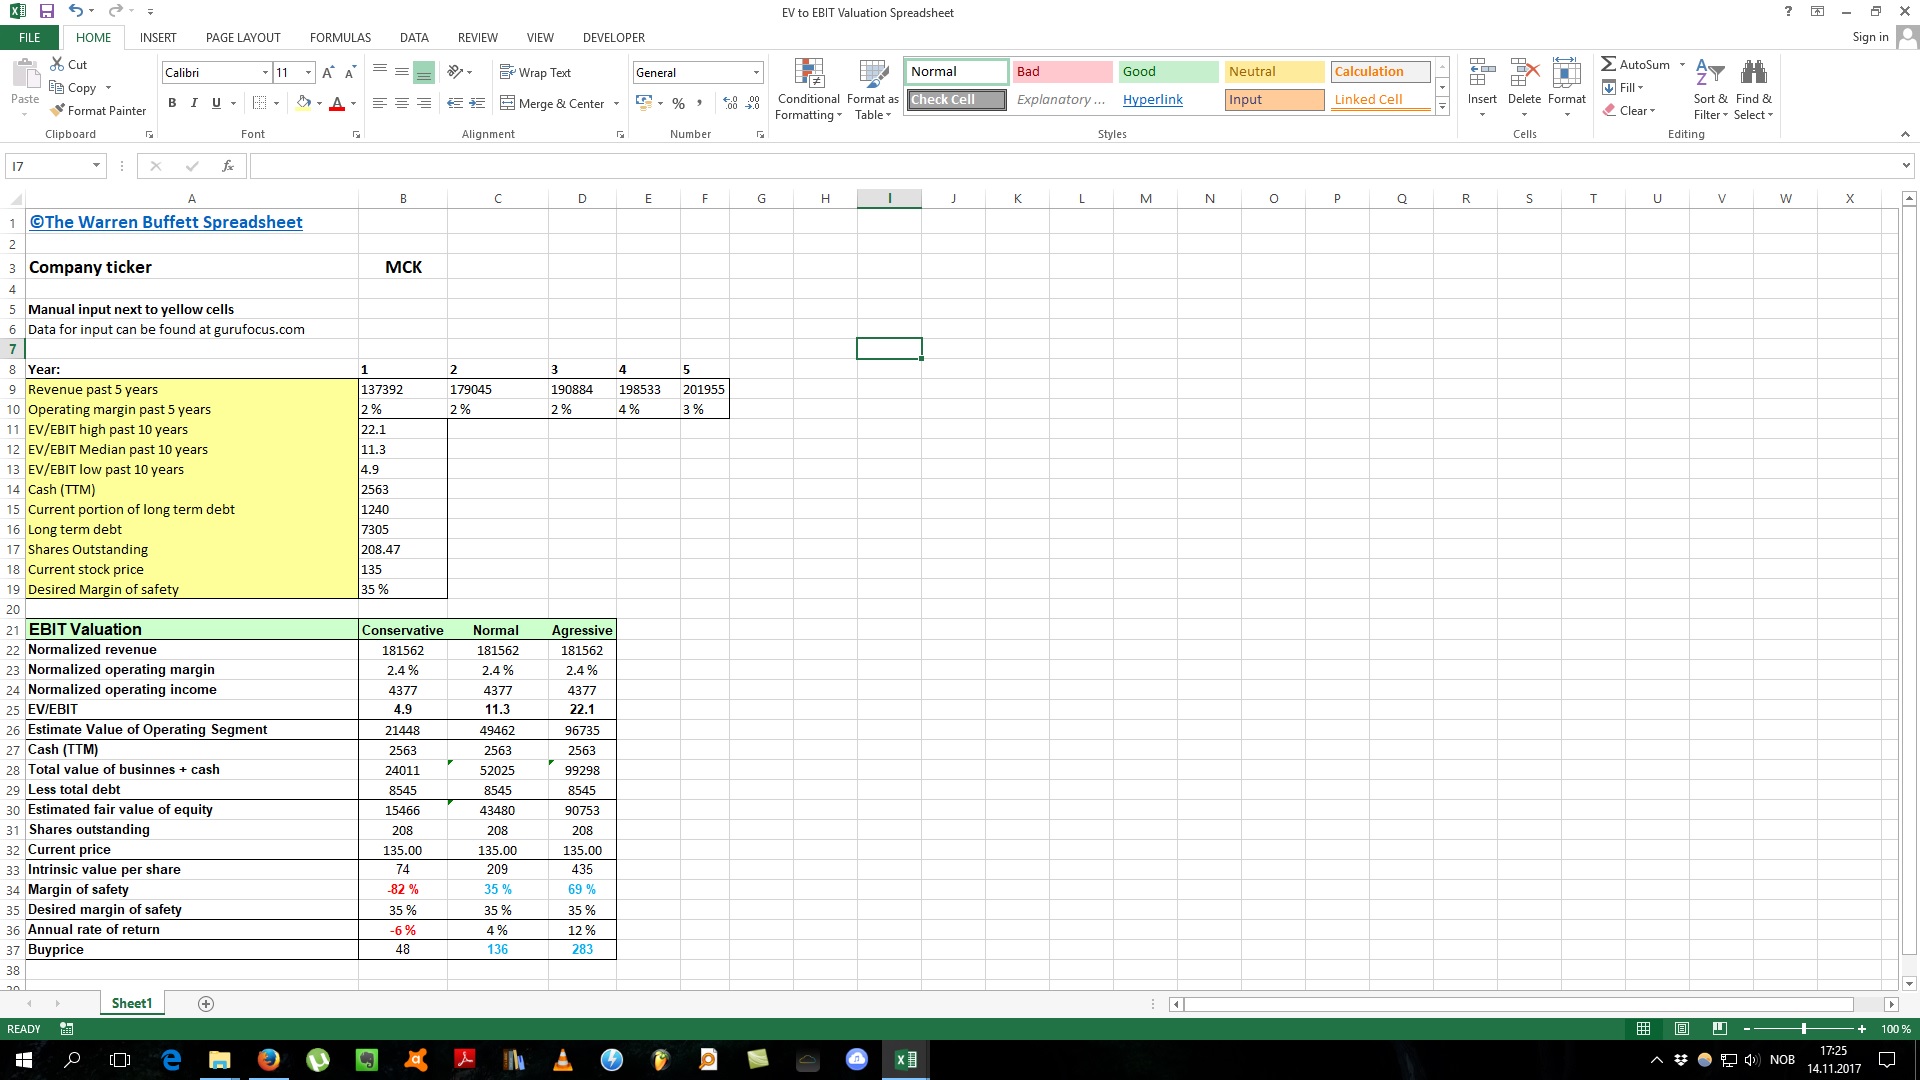
The EV/EBIT Valuation Spreadsheet
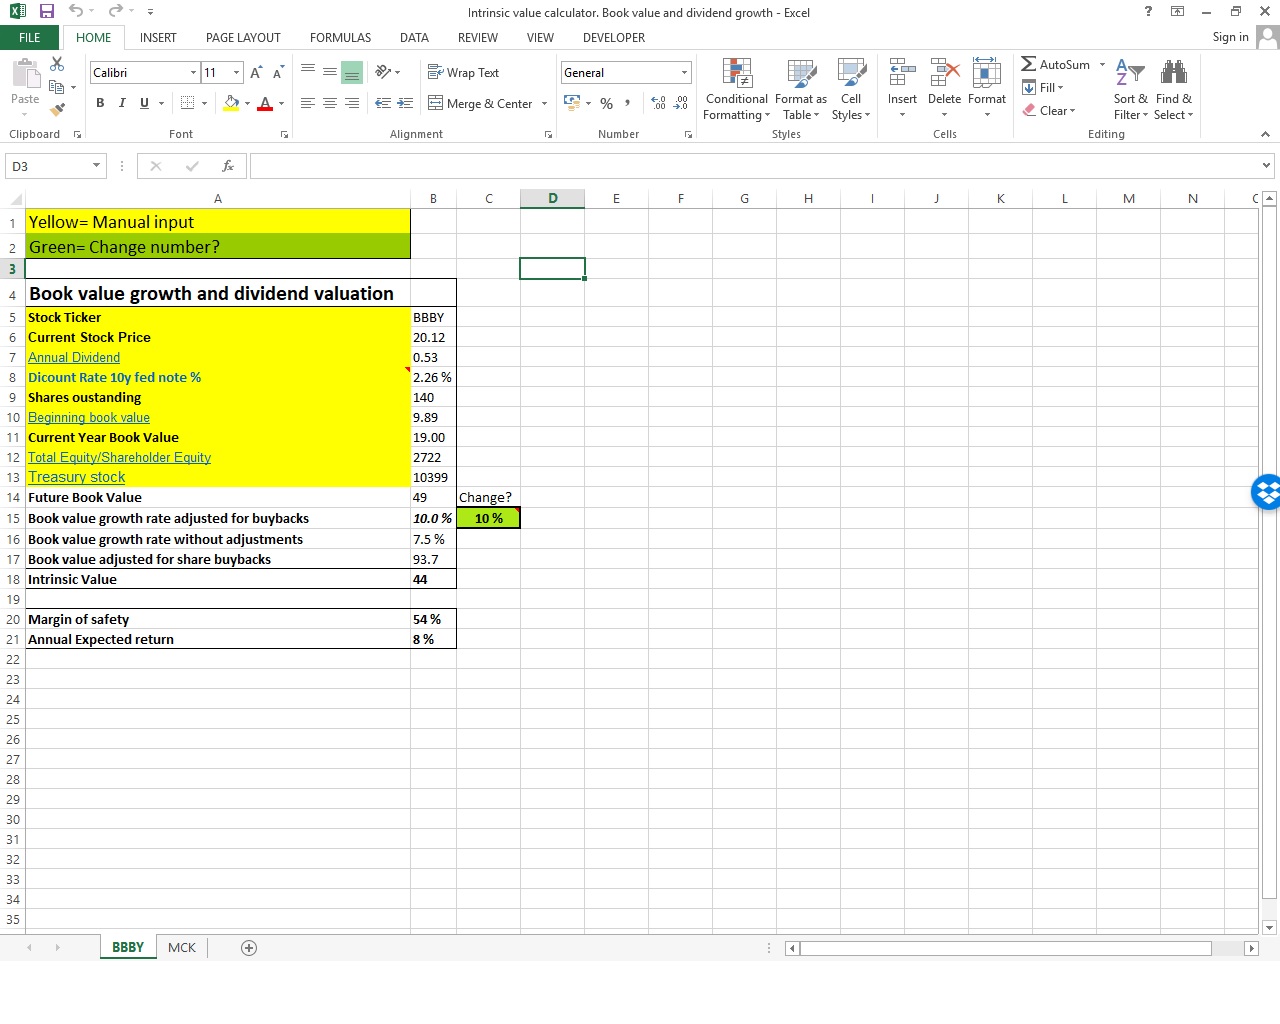
Intrinsic value calculator: Book value and dividend growth
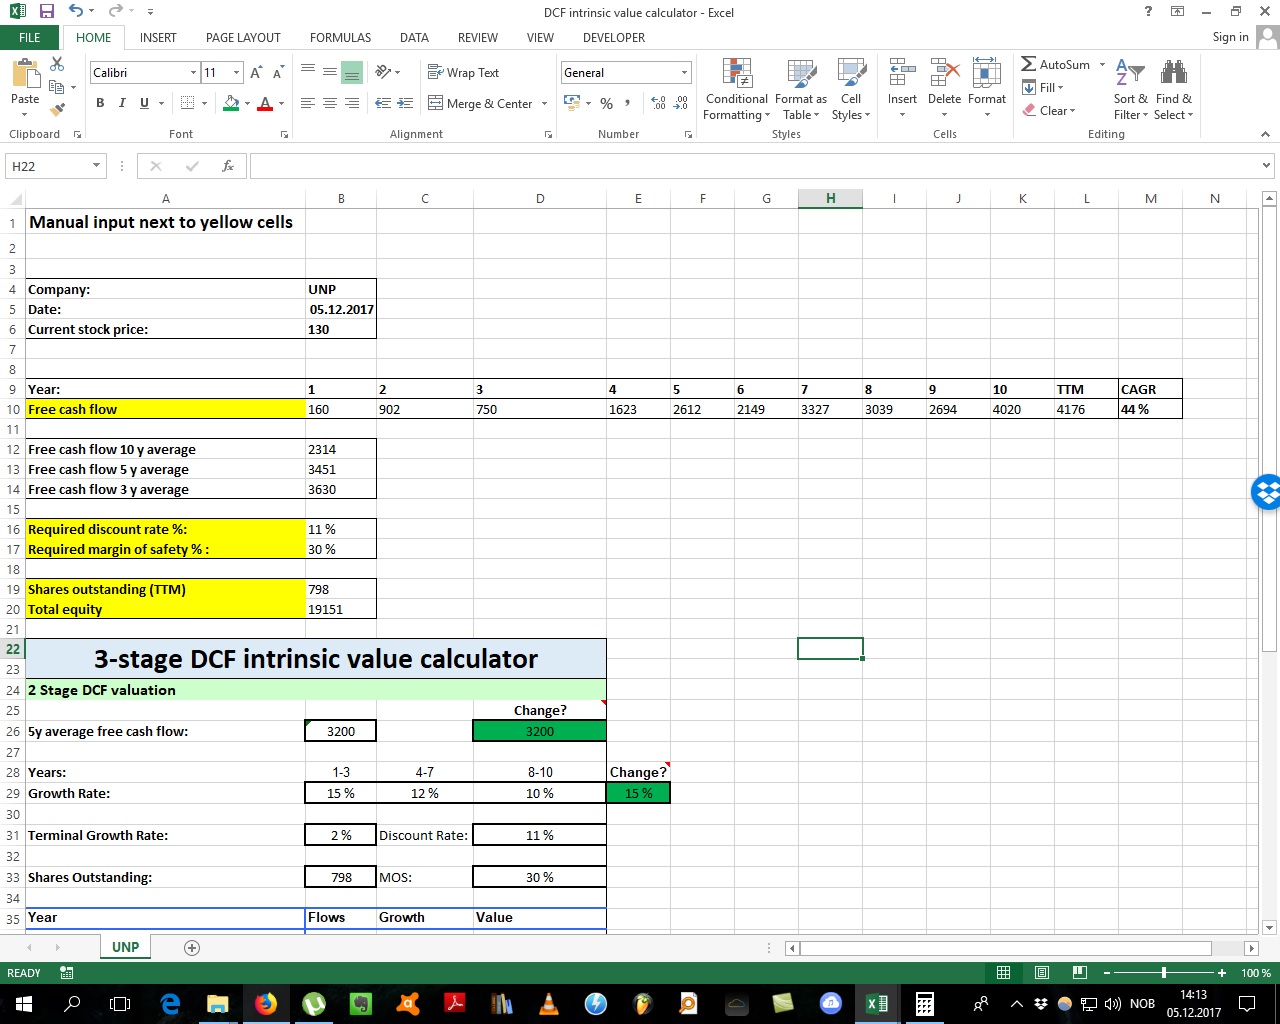
DCF intrinsic value calculator
This calculator estimate the intrinsic value of a stock based on the amount of free cash flow it will produce and the growth rate of these free cash flows in the future. This calculator works best for mature company that has a positive FCF the past 10 years and have stability in their FCF. This calculator does not work well for rapidly growing companies as these can be negative in FCF because all of the cash goes to future cash flow genereating investments.
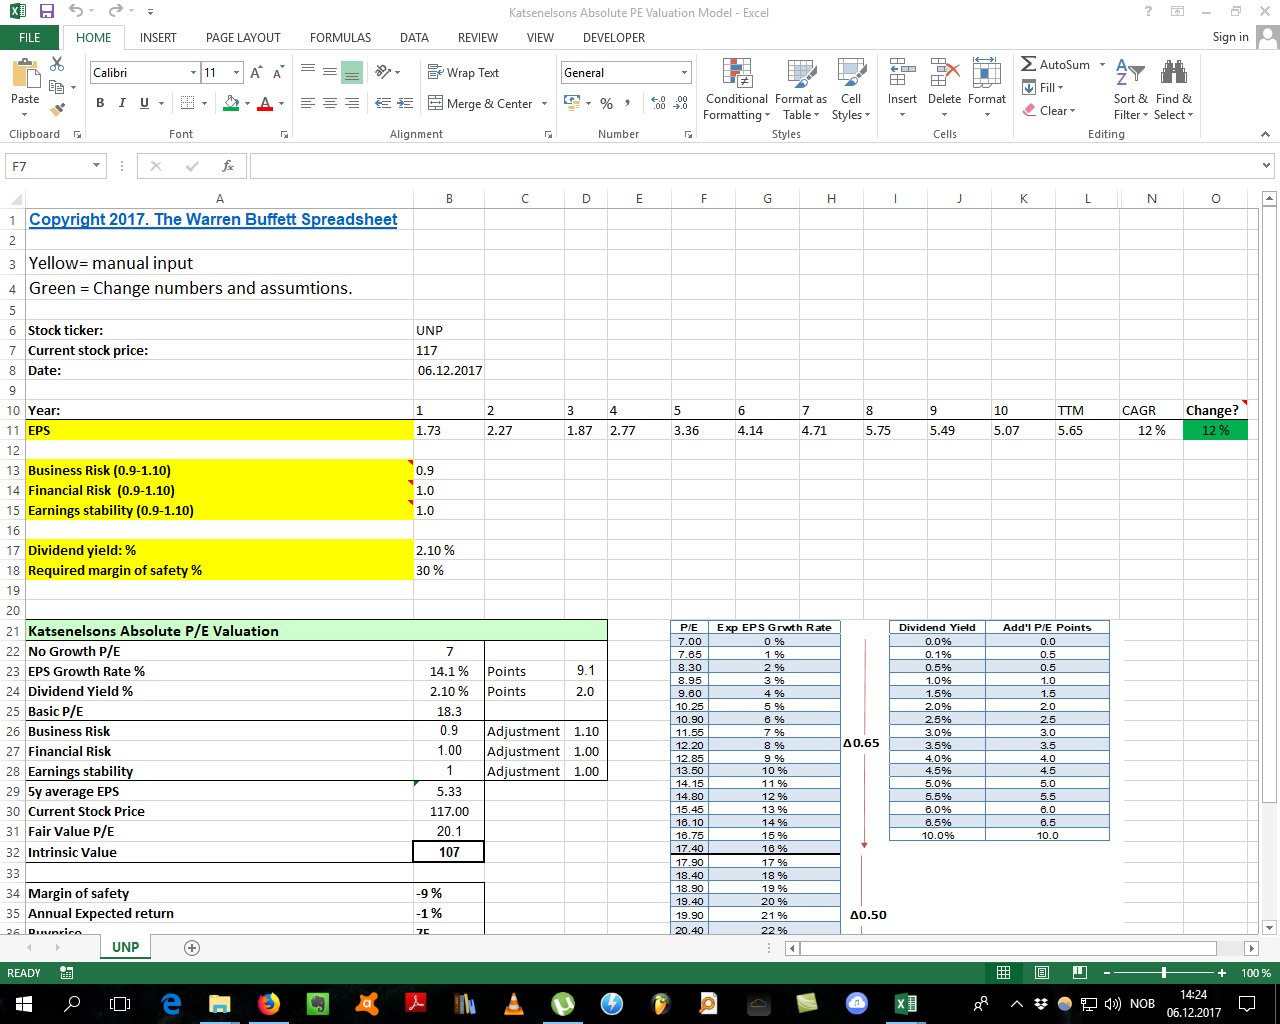
Katsenelson’s Absoulte P/E Valuation Model
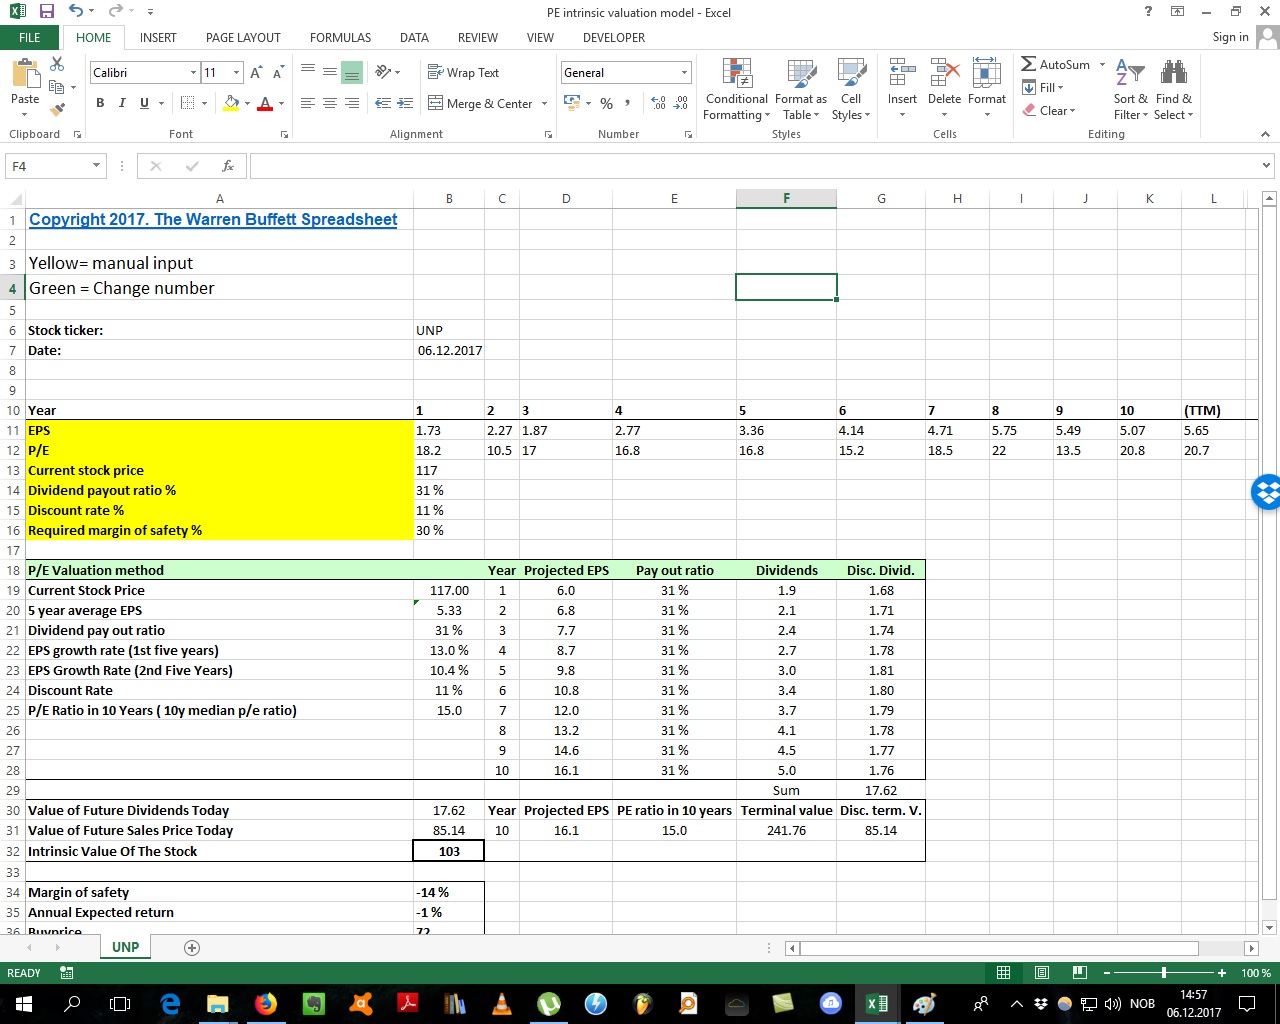
P/E Intrinsic Valuation Model
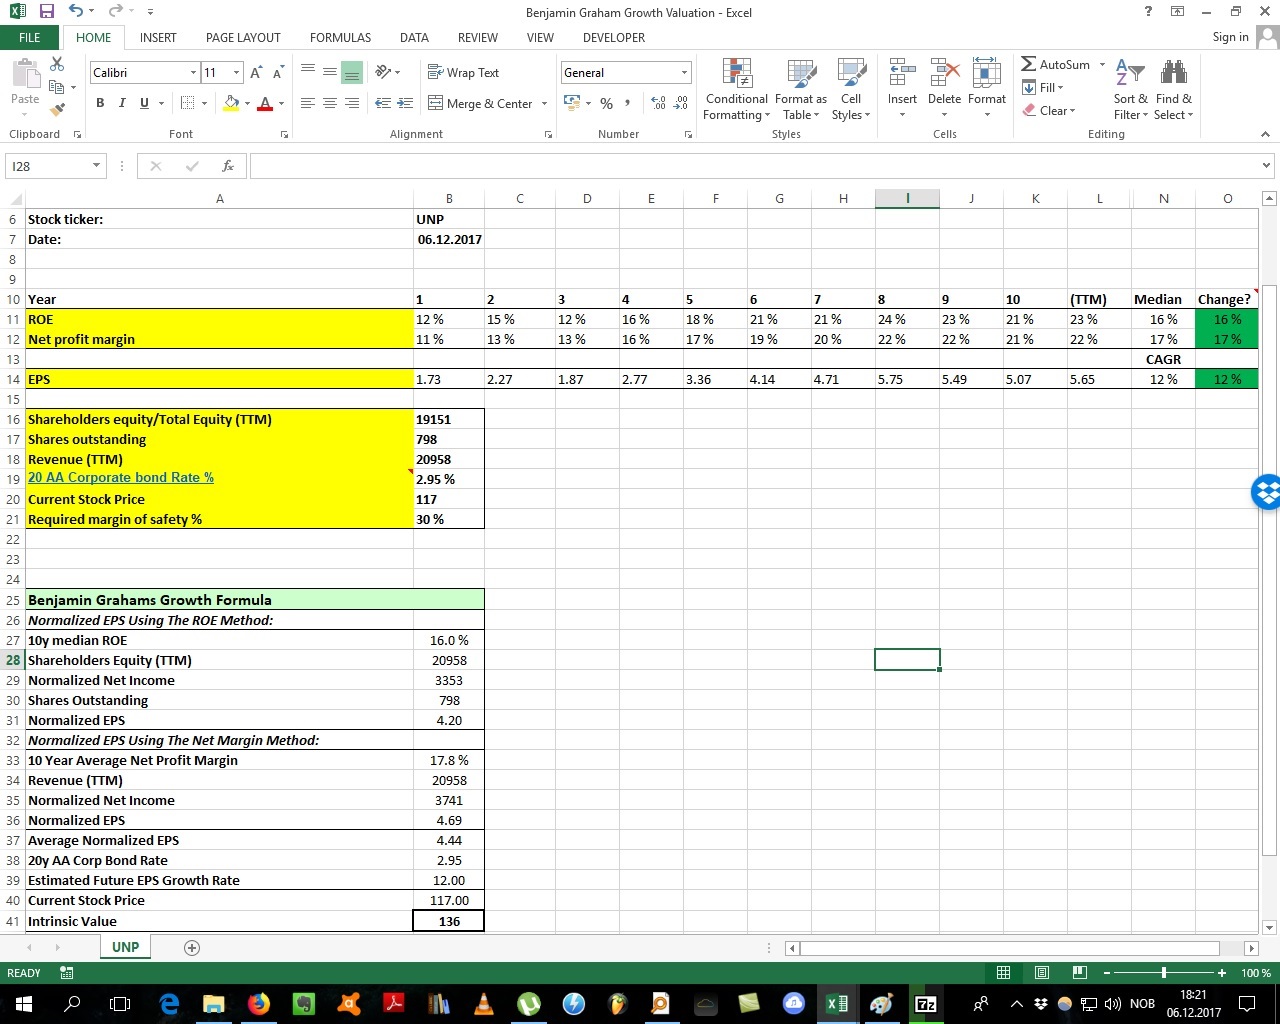
Benjamin Graham Growth Valuation Model
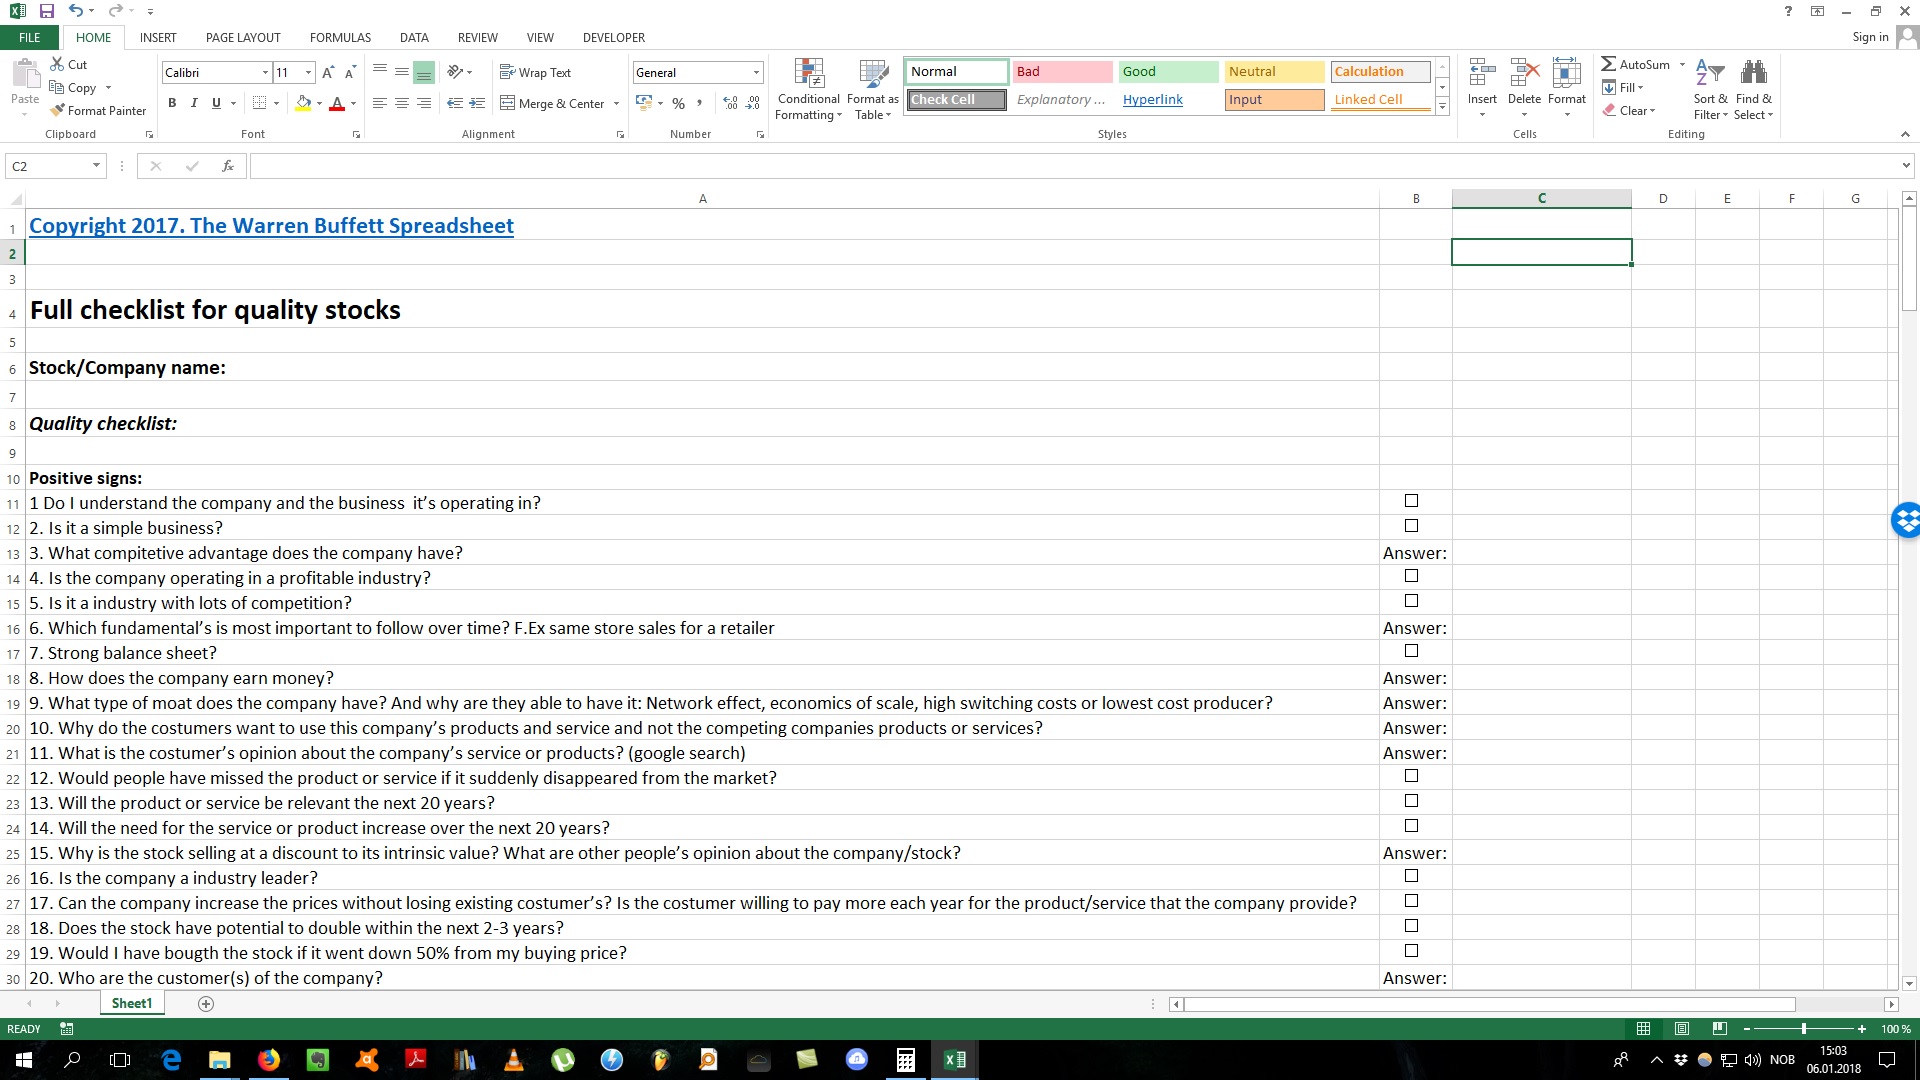
The full stock checklist for value investors
This is a big checklist of 106 checklist items. In addition to that there is important questions you should ask yourself about the company before buying. This list is a collection of checklist questions that I have gathered trough years of reading value investing books. You definately don’t need to check ALL of these items before investing, but I think its a good exercise to look trough them and think about them before investing in a stock. Enjoy!
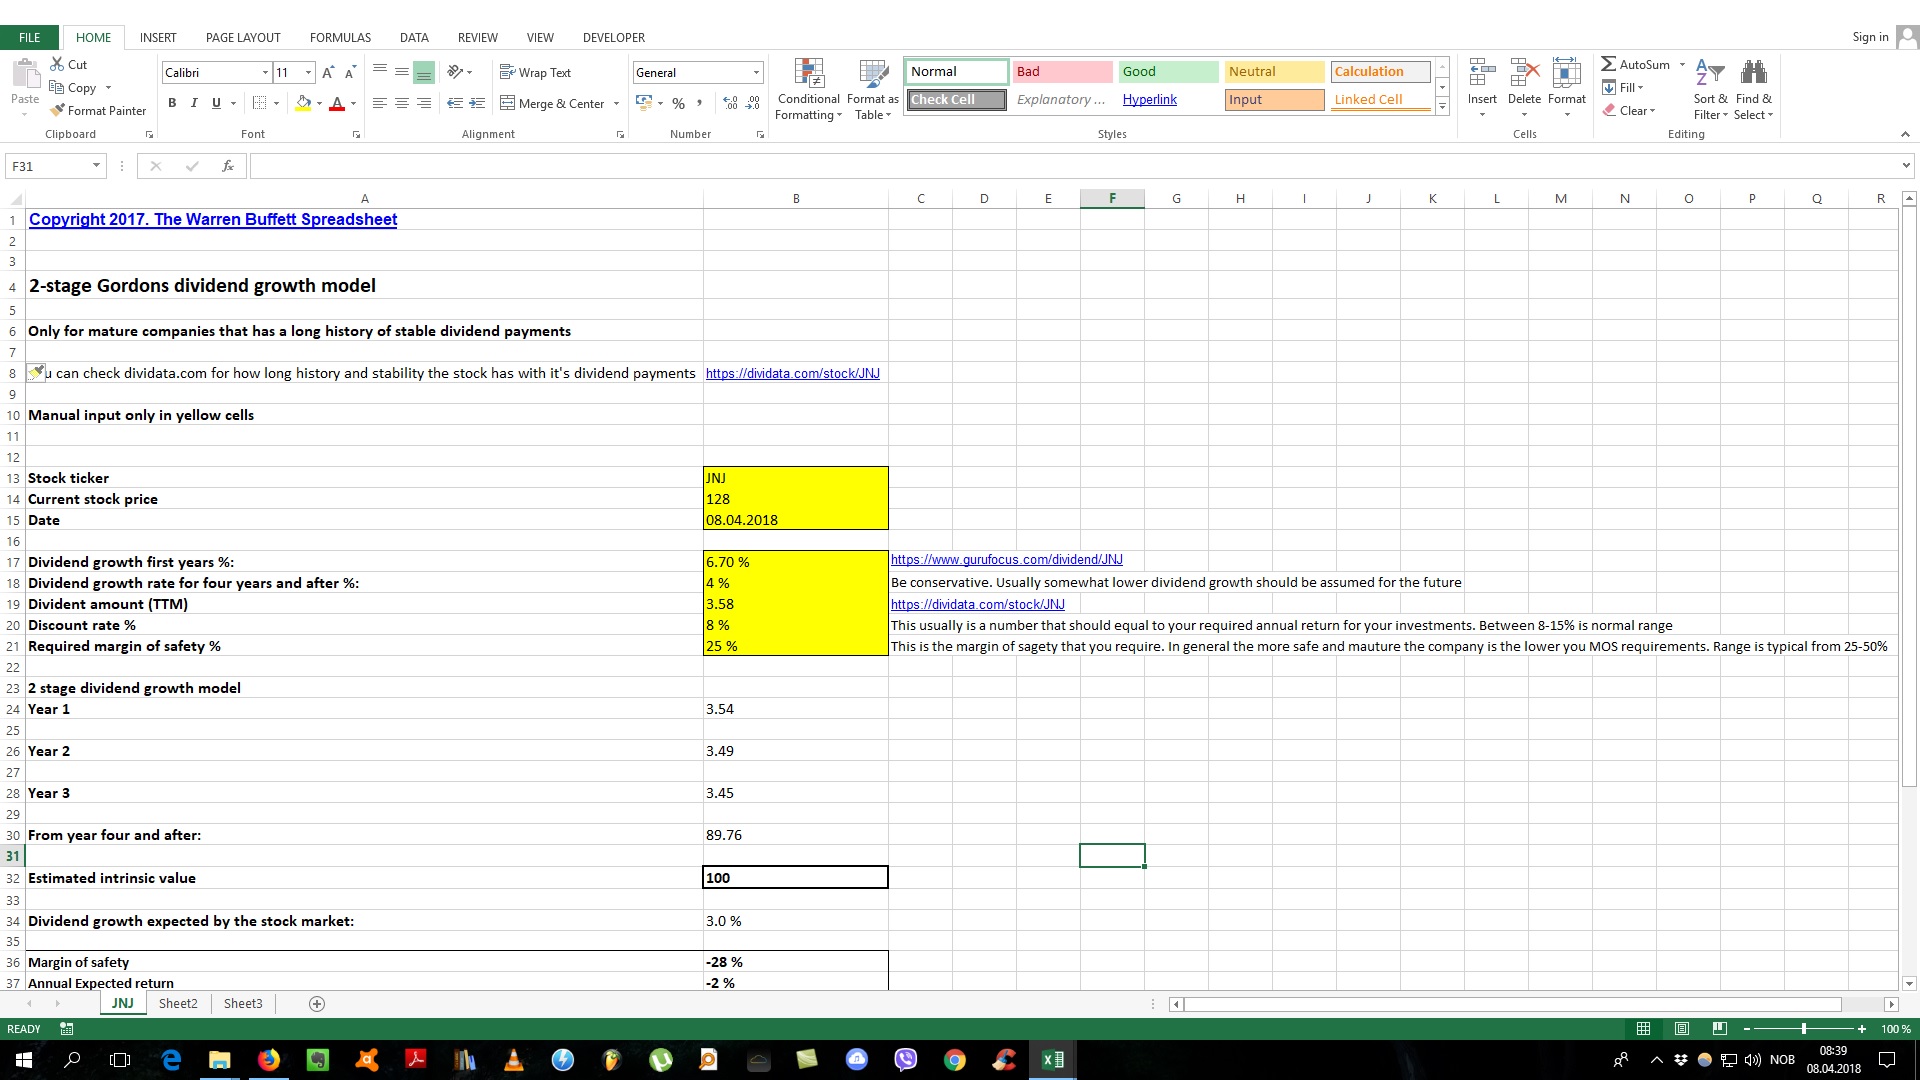
2-Stage Gordon’s Dividend Growth Model
This is a valuation method that works for companies that has a long history of paying out dividends and with stability in the payments.
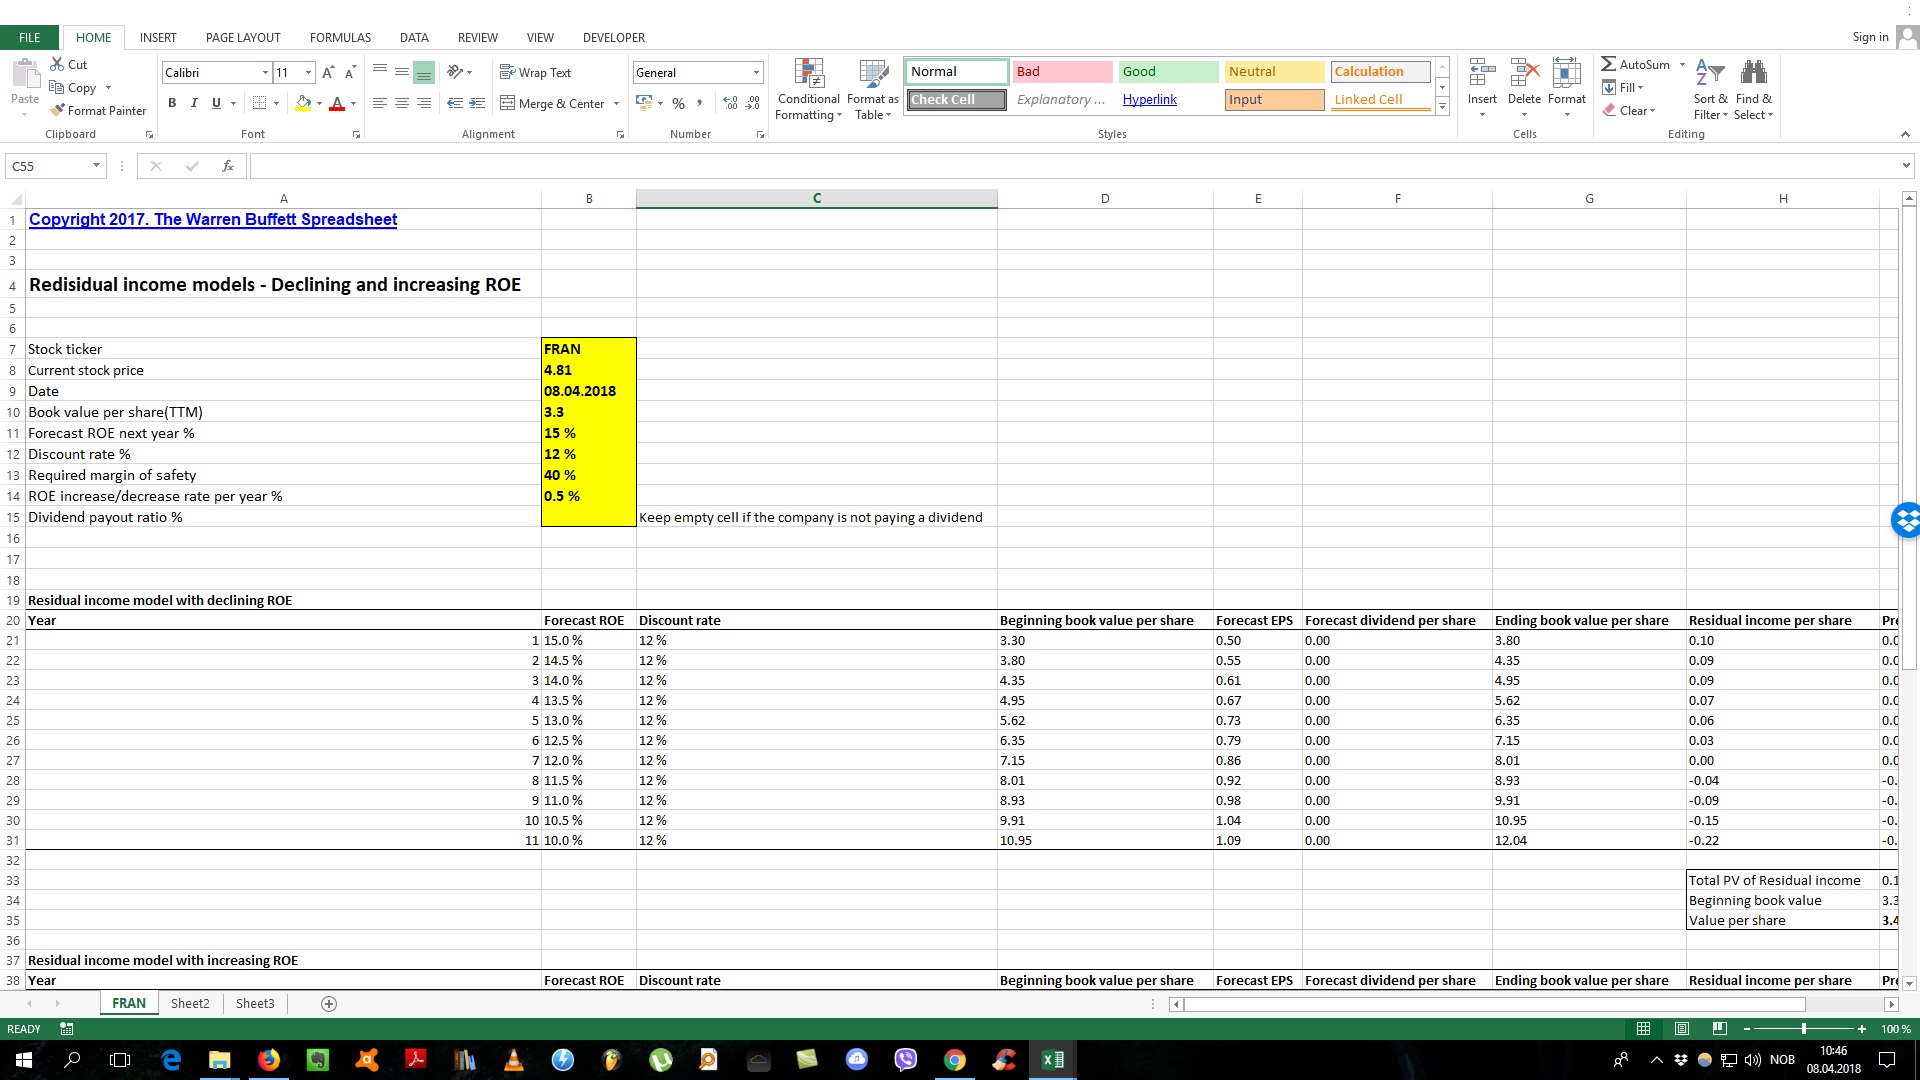
The Residual Income Model
This model is taken from the book “Strategic Value investing”. It is stock valuation in scenarios with declining and increasing ROE (Return on equity) This can give you an idea of the stock valuation in both of these situations.
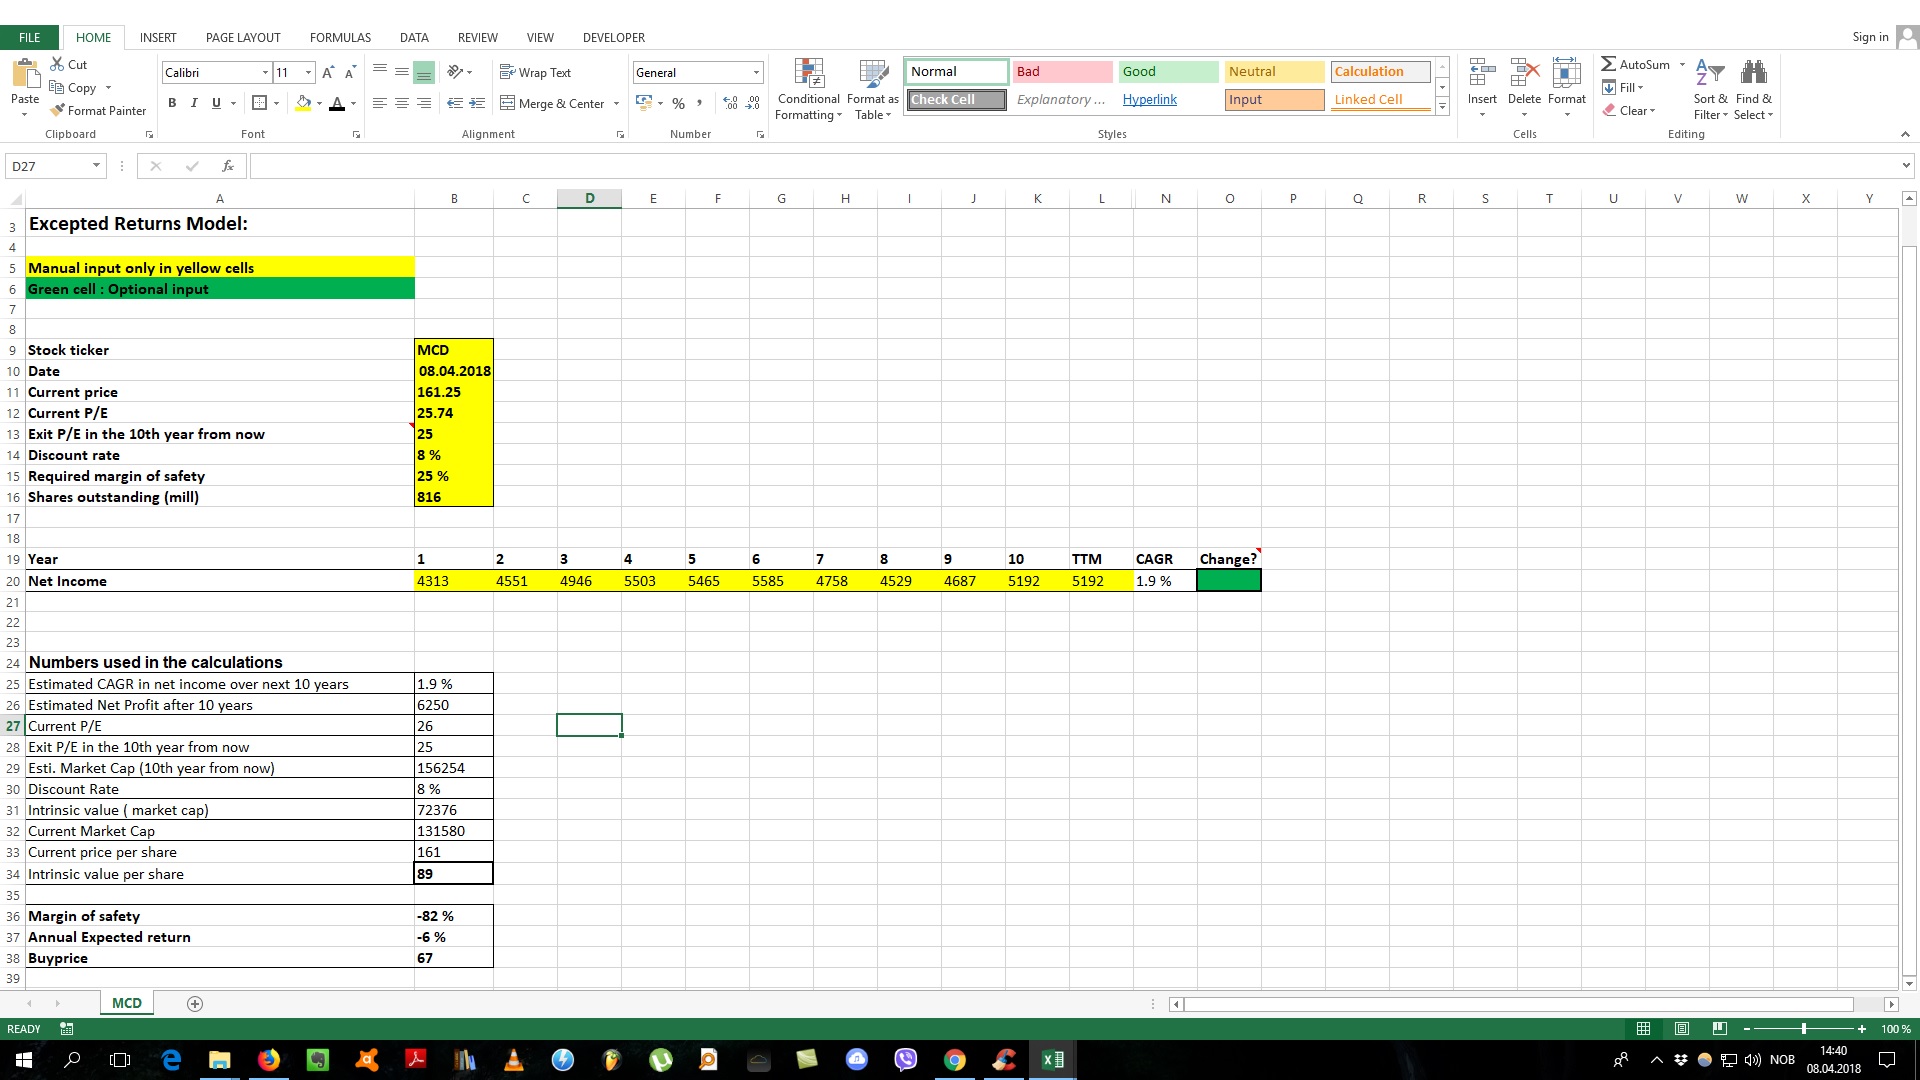
The Expected Returns stock valuation model
Owners earnings calculation
This is the preferred method of Warren Buffett to calculate the true earnings for the shareholders:


wow, thanks for the tools 🙂
LikeLiked by 3 people
Enjoy!
LikeLike
You are welcome
LikeLike
Exactly what I need, thanks for giving us a perspective and tools to look through, I’m glad that I found out your website. Keep up the good work.
LikeLiked by 1 person
Thanks!
LikeLike
Been thinking about making a checklist for a long time. Yours is massive! With the right questions. Thank you, and looking forward to receiving the
Intrinsic calculator
LikeLike
😍😍😍
LikeLike
All very useful and well structured resources, thanks very much Jan!!!!
LikeLike
Manual input only ?
LikeLike
On the free sheets it’s only manual input. On the Warren Buffett Spreadsheet there is automatic import of financial data after typing in the stock ticker.
LikeLiked by 1 person
Hi Jan. Thanks for these spreadsheets, they are an amazing resource and you’ve obviously put a lot of work into them!
One thing i’m interested in is a way of calculating the probability of stock going to a set price (say it’s intrinsic value price). A stock is likely to go to its intrinsic value price but what I think is important is how long will it take to reach that value i.e is there a 80% probability it will reach the IV price in the next 6 months.
Would love to hear your opinion on this and if you think you can get that info out of some of the spreadsheets above.
Cheers
C
LikeLike
Thanks. I don’t think its possible to know for sure when a stock will reach it’s intrinsic value. It can take 1 week or even 3-4 years. If the stock has not reached its intrinsic value in 3 years I will admid my mistake and probably sell the stock. I think in 3 years the market should have at some point priced the stock correctly. Also yes anything can happen, so it’s about probablitites. Not all stocks that are undervalued will be worth more and reach the calculated intrinsic value. However I think every investors at least should try to estimate an intrinsic value for each stock. If not its just pure speculation. And I think the spreadsheets that I have made is useful tools to estimate the intrinsic value. So to conclude you can never be 100% sure that the stock will reach its intrinsic value and you will not know when this will happen
LikeLike
Hey, a question regarding the Reverse DCF calculator. Is it useful calculating the 5y average of operating CF instead of 5y average FCF?
LikeLiked by 1 person
I think there is no 100% correct way to do it. I have even seen gurufocus use EPS in the DCF. The most common one is FCF.
LikeLiked by 1 person
Hey, In your P/E intrinsic sheet the EPS CAGR formula is =(L9/B9)^(1/(10-1))-1. Shouldnt it be 11 instead of 10 since its 10y+TTM cells –> =(L9/B9)^(1/(11-1))-1 or have i missed anything? 🙂
LikeLiked by 1 person
Hi Oscar. The correct is 10. Because is 10 years of growth before the last nr (TTM) So its the numbers before the last the last value you count.
LikeLike
Hi Oscar, Thank you for these spreadsheets they are very useful. One question on the DCF Intrinsic Value Calculator file. Why is the Buyprice (cell B61) calculated off the current price (cell B9) and not the Intrinsic Value (cell B57)?
My understanding is we want to discover the true value of the company (Intrinsic value) and then buy at some margin of safety below that value. So if our IV is $419/sh and we want to but at a 20% margin of safety from the true company value, the maximum Buyprice would be $293 ( 80% x 419)? Thank you.
LikeLike
Hi Eric. You are of course correct!. That is me going to fast when making the spreadsheet. The margin of safety should be calculated of the estimated intrinsic value. I will correct the spreadsheet now.
LikeLike
I fixed it now
LikeLike
Hi sir, I see there are 3 kinds of intrinsic value calculators, should we use all of them or just one of them, or maybe you can combine all of the intrinsic value calculator. Because, as long as my study I just know one type of intrinsic value calculator
LikeLike
In the WB spreadsheet there are 8 different intrinsic value calculators. It’s usually a good idea to look at many different valuation methods to see what kind of results they give. If all shows undervaluation it’s usually a good sign. Also you should focus more on the IV calculator that is most suited to the type of stock you analyze. For example a stock with very stable free cash flow and stable growth and margins, then the DCF calculator works well
LikeLike
Hi Oskar,
Thanks for the Spreadsheets, looking forward to using them.
LikeLike
Hi Keith this is Jan. Thanks!
LikeLike
this is amazing, THANK YOU for all the effort you put into this and thanks a million for sharing it!
LikeLike
Thanks Amit
LikeLike
Great info very Valuable and organized. I am beginning to start my new chapter in life is investing in IPO’s I have been reading studying IPO’s but need a formula or sheet i may use anytime i get a list for potential ipos, so when i place my order i did my due diligence. ThanksI need Documents to best use to give me a blue print when evaluating a potential business going public. is there a check list you have your treasure chest? also i need an excel document to input what the prospectus gives us if see if it is a potential investment for me. Thanks again for your time:) rmroueh08@yahoo.com
LikeLike
Hi Ray. Thanks! From the books I have read investing in IPO’s is generally not recommended. Statistically IPO’s shows an underperformance the first 6-12 months or so after IPO. There might be a couple of reasons for that. 1. The company wants to sell the stock at the highest possible price on IPO day so that they can raise the maximum amount of capital. This is not good for us investors who want to buy. 2. Fear of missing out. Usually IPO’s gets hyped up and its in new and exciting industries. This makes many wants to participate in the IPO and thus creating a “crowded bet” that we investors generally don’t want from the beginning. So the research say that it’s probably best to wait at least 12 months after the IPO to increase the chance of a high returns investing in IPO’s. Remember that IPOS are jokingly nicknamed “It’s probably overpriced” However I am sure there are some IPO’s that are fantastic buys if you are able to determine the quality and price of these IPO’s. Just be aware that you have your odds against you when investing in IPO’s. Just my thoughts. I am no expert in IPO’s. Good luck! 🙂
LikeLiked by 1 person
Thanks for Sharing. Very nice of you
LikeLike
Thanks!
LikeLike
Am I missing how to download the complete file? How much does it cost? Also is it more automated then the free versions
LikeLike
The Warren Buffett Spreadsheet can be found here: https://warrenbuffettspreadsheet.wordpress.com/the-warren-buffett-spreadsheet/
It cost 20 USD.
LikeLike
JUst ordered it please send as soon as possible I cant wait top start using it. Also please make sure it is the newest version because the comments here all state the file needed to be updated to account for morning stars update
LikeLike
Of course
LikeLike
Why does the calculations for the Benjamin Graham formula always differ vastly from what is posted on gurufocus?
LikeLike
Hi Robert. Sorry for the late reply. But the Graham valuation method that is used in the spreadsheet is something different than the Graham Number that Gurufocus uses. As I am aware of gurufocus does not use the Graham valuation method.
LikeLike
JUst ordered it please send as soon as possible I cant wait top start using it. Also please make sure it is the newest version because the comments here all state the file needed to be updated to account for morning stars update
LikeLike
I always send out my newest version of the spreadsheet 🙂
LikeLike
I purchased the calculator and it stopped working soon after. I used it for a couple of weeks. Is there any way to get an uppdated copy. Thanks.
LikeLike
I that must be the automatic version? Yes it stopped working. You can email me and I will send you the latest updated manual version of the spreadsheet.
LikeLike
I have purchased your WB spreadsheet but I do not have a Grufocus or Morningstar account. So what should I do?
LikeLike
Hi Trinh
You only need a free registration with gurufocus. Morningstar you don’t need to register anything. I have also included a Morningstar only input spreadsheet in the mail I just sent you.
LikeLike
Hey Jan,
Amazing stuff you provided. Extremely helpful! i was wondering if you have any other resources like videos on how to use the intrinsic value calculator book value and dividend growth. i seem to be putting my numbers in correctly i believe but my numbers don’t seem correct. i know its most likely user error but i wanted to see if there was a step by step tutorial on how this is done correctly.
Thank you.
LikeLike
Hi Martin. I think this video explains the logic and how to do the book value+dividend valation: https://www.youtube.com/watch?v=S1wbCieoHs4&list=PLD3EB06EC4A19BFB8&index=10
LikeLike
And thank you very much for you kind words!
LikeLike
Hello, thank you very much for all the free material on Value Investing. I was just wondering where you get the ‘Required Discount Rate %’ for a given security. Is this the companies WACC?
LikeLike
Thanks. I don’t use or are familiar with WACC. Required discount rate is the annual return you “require” from you stock. So a higher rate means a higher hurdle before a stock gets attractive.
LikeLike
I Can’t open the download spreadsheet, what can I do for open it.
LikeLike
Which spreadsheet?
LikeLike
Dear Sir. I tried all the download links and none of them works. Could you please update the download link
LikeLike
Works fine on my computer. Do you get any error message?
LikeLike
THanks for your excel spreadheet, they are really useful
LikeLike
Hi Fabrizio. You are welcome!
LikeLike
Hi Jan,
thank you for posting these useful spreadsheets and sharing your knowledge with everyone.
I noticed in the links to the free spreadsheets the Copyright is dated 2017.
Does that mean the free spreadsheets are old versions, and that we will only get the latest version/s if we make a purchase?
Thank you,
Jo
LikeLike
Hi Jo. There are no new/old actually. It’s just that with the automated Google sheet spreadsheet get all the data automatically imported and calculated. More manual work with the manual input sheets
LikeLike
hi do you have spreadsheet to estimate future price target? thanks in advance.
LikeLike
Yes I have. https://warrenbuffettspreadsheet.wordpress.com/the-warren-buffett-spreadsheet/
LikeLike
Amazing that you make these available for others! Thank you so much! 🙂 I just started investing 8 months ago so still have a lot to learn, but it is great to see all these calculations so I can understand it all better. Will definately check out the Warren Buffet spreadsheet too!
LikeLike
Thank you Lisa!
LikeLike
Than you so much
LikeLike
Stupendo, Fntabeoulously, Fantastic, Masmagoric work done by you.
Thanks
LikeLike
Thanks my friend
LikeLike
Great stuff
Thanks !
LikeLike
Happy to help
LikeLike
Hi, I just ordered the automated version. When can I expect a link to the spreadsheet? Is there a warrenbuffetspreadsheet community? Thank you beforehand, Laurent
LikeLike
As written on the webpage. I will manually send you the links within 24 hours after purchase 🙂
LikeLike
Hi Jan! Thanks for the content. I have a question on the “DCF Intrinsic Value Calculator” spreadsheet on cell B57, “Terminal Value”: Why do you calculate the PV of TV using a Gordons Growth Formula but then you add the equity value at the end of the formula “+ B28”. From my understanding the sum of the PV of FCFs + PV of TV would result in the EV, which then must be subtracted the Net Debt to reach the Intrinsic Equity Value (divided by #Shares = Intrinsic Share Price). I don’t understand why the “+B28” at the end of the Terminal Value
LikeLike
Hi Gancalo. You are correct. Seems like I did a mistake there. I have corrected it now.
LikeLiked by 1 person
Goncalo. I guess its 2 options it seems like. Levered DCF and Unlevered DCF. Levered DCF subtracting net debt from total present value of cash flows?
LikeLike
Hi Jan. Could you give us the corrected formula and the cell so we can update our spreadsheets. Thanks.
LikeLike
The DCF excel sheet should have been updated now
LikeLike
So in your model we should plug in free cash flow to equity (FCFE) rather than FCFF. This way we directly get to the Equity Value instead of Enterprise Value and no need to subtract Net Debt
LikeLike
These terms are new to me. Could you give a simple example? (Fcfe)
LikeLike
FCFE is the firm’s free cash flow after debt and claims of debtholders are paid. The debtholders receive their payments first, and what’s left of it goes to the shareholders (equity holders). That’s why it is called free cash flow to equity instead of free cash flow to firm. My question is: in your model, since you disregard net debt, do you use as inputs FCFE or FCFF?
LikeLike
Quite sure that is FCFF. I have used the free cash flow numbers from morningstar.com
LikeLike
Right, then the discounted FCF’s + Terminal Value should result in the Enterprise Value of the firm. Which then you must subtract the Net Debt, resulting in Equity Value (Mkt Cap). At least that’s how I learned in Uni. Not sure if it applies in practise.
Without that, I think you are comparing your model’s resultant EV to the actual Market Cap (YahooFinance) of the company to understand if its undervalued or not, which isn’t consistent
LikeLike
I understand. Thanks for you inputs. I see online that there are DCF that does not include net debt in the calculations and some that does. I believe that substracting the net debt can in some cases severely reduce the intrinsic value of a company using the dcf model. I will think about that 🤔
LikeLike
Thank you for the prompt reply after my order ! best regards Gerard-Jan
LikeLike
You’re welcome
LikeLike
I was wanting to purchase but note the Morningstar formatting of information on the website has changed. For example there is no “valuation history”, no “key ratios”, no “profitability”. I am only interested in Australian shares at the moment, and see that the Morningstar website for Australia has differences to the US format. Any thoughts how this can be resolved?
Regards, Ian
LikeLike
Hi Ian
Unfortunately the spreadsheet broke just recently because Morningstar made some major changes to their site. Trying to find a solution now together with a programmer. If you subscribed to the spreadsheet updates, you will be notified when it’s fixed with a link to a working version. We have in the past always found a solution, but I can’t say how long it could take.
Sorry about this.
LikeLike
I Am From India. Thanks, Because you provide all EXCEL for free. (01/05/2021 to 23/07/2022) 249 Days I continue to study about stock market and value Investing. Today Morning i find your website, Now i am going on 3 Stage of my leaning After i download your Free Excel Sheet, I jump 5th Stage Of my learning. Thank You very Much. I am really Happy.
LikeLike
Thanks. Nice to hear!
LikeLike